
Figure 6. Transmission electron microscopic analyses of ST- and MBH-derived synaptosomal mitochondria.
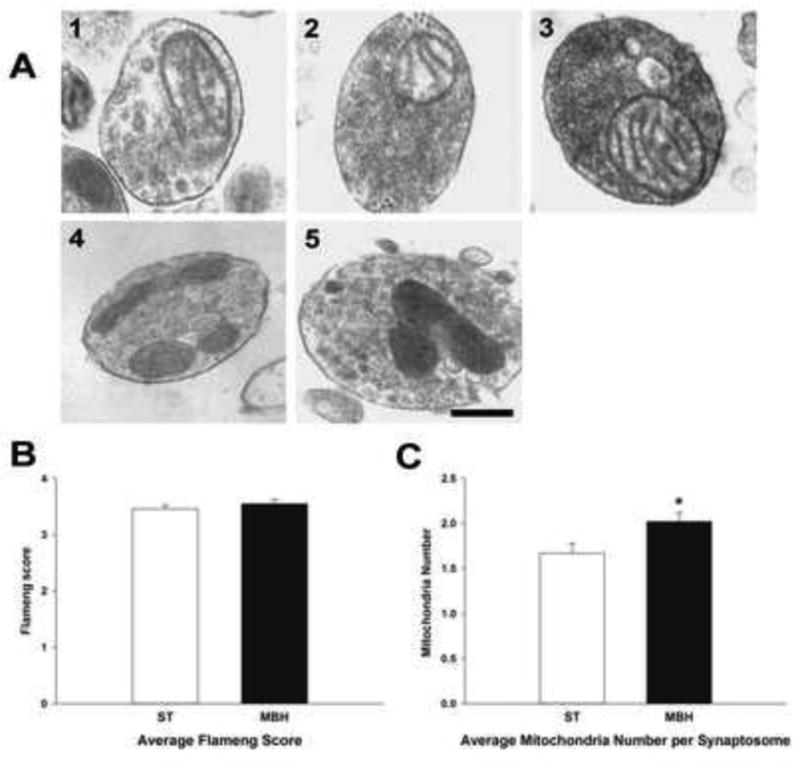
A; Photomicrographs depicting representative Flameng mitochondrial scores of ST-derived synaptosomes. Score 1: broken cristae with ruptured mitochondrial membrane, Score 2: broken cristae with matrix clearing but membrane intact, Score 3: swelled mitochondria with cleared matrix but intact cristae and membrane, Score 4: intact mitochondria, Score 5: intact mitochondria with mitochondrial granules. (Scale bar = 50 μm). Average Flameng mitochondrial scores (B) and average mitochondria number per synaptosome (C) of ST-derived (open columns) and MBH-derived (closed columns) synaptosomes. Synaptosomes were fixed, sectioned and at least 200 mitochondria from randomly selected images were analyzed. Mean mitochondrial functional score was calculated by averaging Flameng mitochondrial functional scores from at least 200 mitochondria from each experimental group. Mean number of mitochondria per synaptosome was derived by dividing total number of mitochondria by total number of synaptosomes in each experimental group. The experiment was repeated four times with + 1 standard error of the mean. * indicates mean number of mitochondria per synaptosomes in the MBH that were significantly different (p<0.05) from those in the ST.