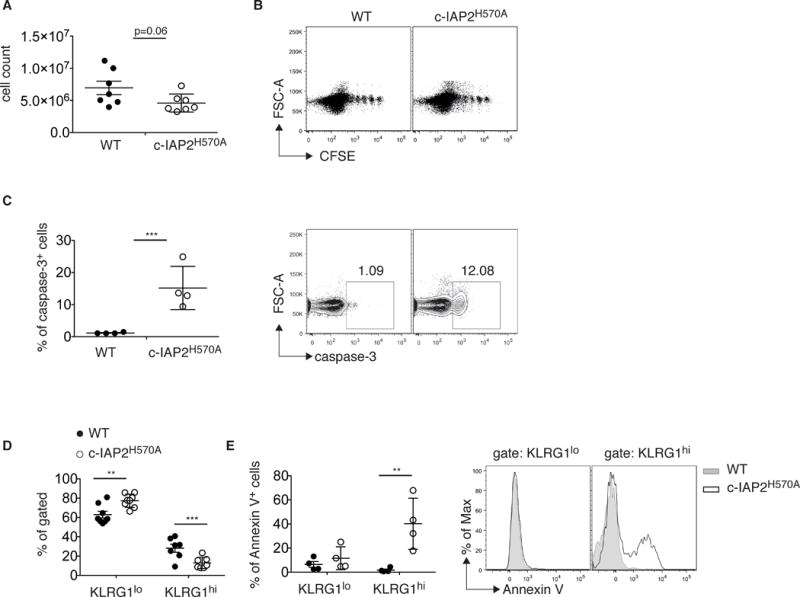
Figure 5. Apoptotic death of CD8+ c-IAP2H570A cell during acute homeostatic proliferation.

T cells were purified from CD45.1 WT and CD45.2 c-IAP2H570A and adoptively transferred into RAG1-deficient hosts. Recipients were analyzed by flow cytometry after 20 (n=3) and 29 (n=4) days and results were pooled. (A) Graphs depict the absolute numbers of CD45.1 WT and CD45.2 c-IAP2H570A CD8 T cells. (B) A representative dot plot of CFSE dilution on day 29 of reconstitution is shown. Each dot shows an individual mouse and data is from a pool of 4 mice at each time point. (C) Frequency and a representative dot plot of cells positive for activated caspase-3 29 days after transfer. Each dot shows an individual mouse. (D) Frequency of KLRG1-low and -high cells and (E) of Annexin V-positive cells gated in KLRG1-low and -high cells 29 days after transfer are shown. Each dot shows an individual mouse. One representative histogram of four is shown. All bar graphs represent mean ± SEM; **p ≤ 0.01, ***p ≤ 0.001; Student’s t-test was used for statistical evaluation.
