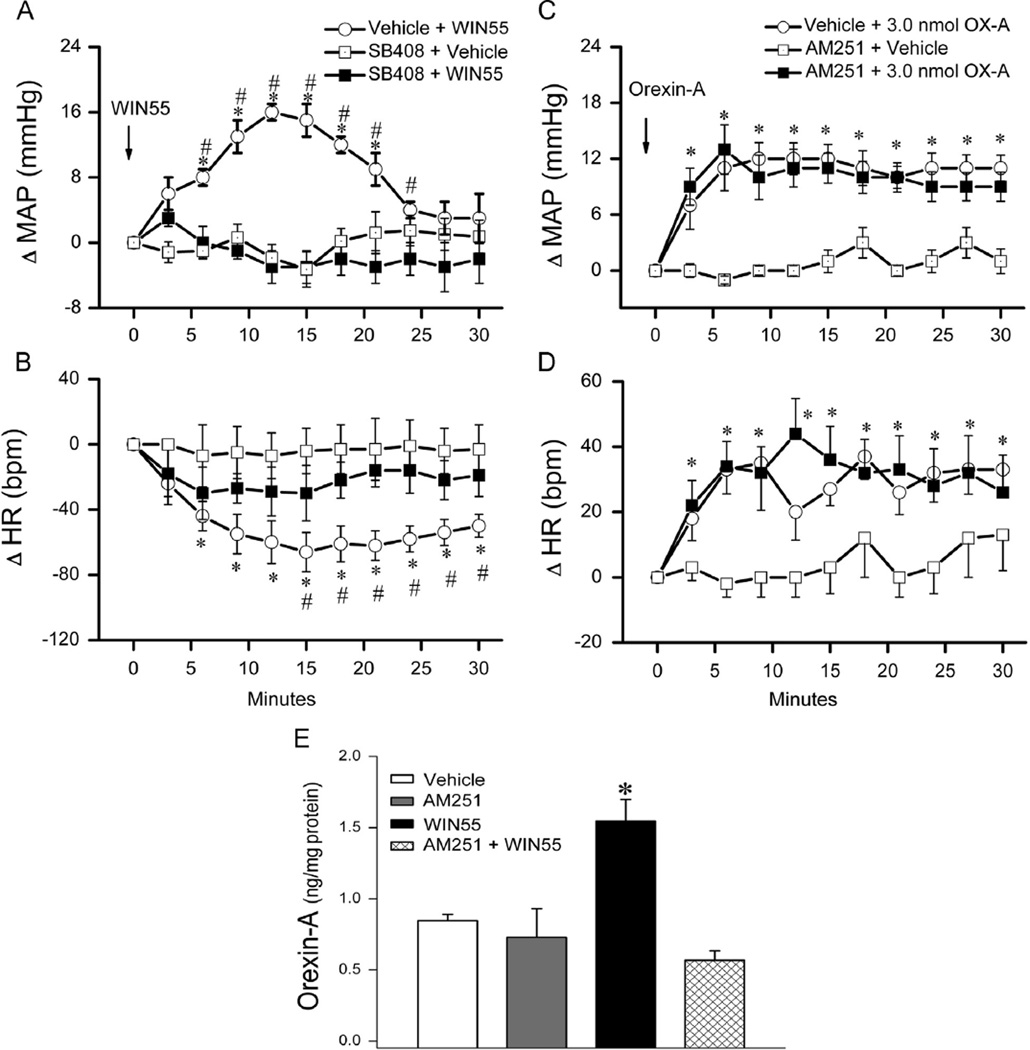
Fig. 4.
Time course of changes in mean arterial pressure (MAP) (A), heart rate (HR) (B) evoked by intracisternal (i.c.) WIN55,212-2 (15 µg) (Veh+WIN55) or its vehicle, indicated by the arrow (top panel), in conscious rats pretreated, 10 min earlier, with the selective OX1R antagonist SB-408124 (10 nmol, i.c.) (SB-408124+WIN55) or vehicle (SB-408124+Veh). Values are mean±S.E.M. of 5 to 8 observations. * and #p<0.05 versus respective “SB-408124+Veh” and “SB-408124+WIN55” values. Time course of changes in MAP (C), HR (D) evoked by orexin-A (3 nmol, i.c.) (Veh+orexin-A), (reblotted from Fig. 3) or its vehicle, indicated by the arrow (top panel), in conscious rats pretreated 30 min earlier with selective CB1R antagonist AM251 (30 µg, i.c.) (AM251+orexin-A) or equal volume of vehicle (AM251+vehicle). Values are mean±S.E.M. of 5–8 observations. *P<0.05 versus respective (AM251+vehicle) values. (E) Changes in RVLM orexin-A level, determined by ELISA as detailed under methods, in four additional groups of animals that received one of the following i.c. treatments: (vehicle; n=3), (vehicle+WIN55,212-2; n=5), (AM251+vehicle; n=4) or (AM251+WIN55,212-2; n=5). Animals were sacrificed at 10 min, a time that coincided with the peak of the WIN55,212-2-evoked pressor response. Bar graphs represent mean±S.E.M. Data analyzed by one-way ANOVA followed by Bonferroni comparison test. *P<0.05 compared to “vehicle” and “AM251+WIN55,212-2” values.

