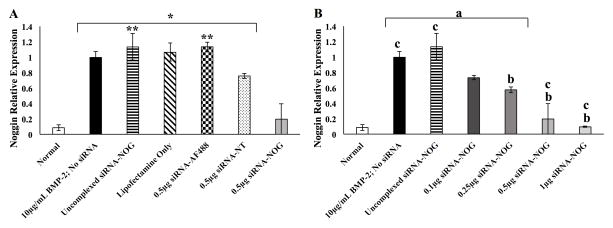
Figure 8.
MC3T3-E1 cell noggin mRNA expression levels with indicated treatment by surface-mediated transfection of siRNA as quantified by qRT-PCR at 48 hours (n=3; mean relative quantity ± standard error of the mean). All groups received 10μg/mL rhBMP-2 except “Normal” cells that were not treated with rhBMP-2. Noggin mRNA levels were normalized to 10μg/mL BMP-2; no siRNA treatment. (A) siRNA groups treated at 0.5 μg per well including non-target (NT) control with Lipofectamine and siRNA-Alexa (siRNA-AF488) control with Lipofectamine as well as siRNA-NOG not complexed with Lipofectamine.*p<0.05 versus Normal (MC3T3-E1 cells not treated with rhBMP-2), **p<versus 0.5μg siRNA-NT (B) Lipofectamine siRNA-NOG complex dose response. ap<versus Normal, bp<versus 10μg/mL BMP-2; no siRNA, cp<0.05 versus 0.25μg siRNA-NOG.

