
Figure 2.
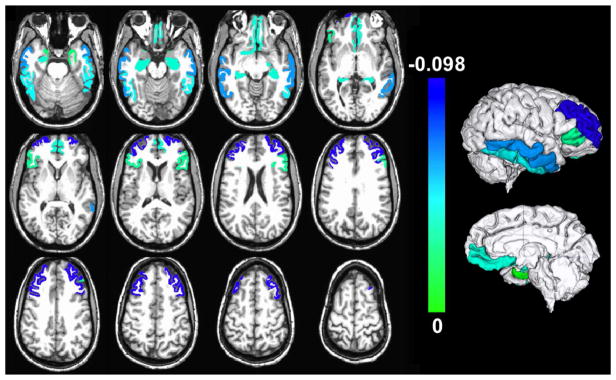
Gray matter regions with significant negative association between their normalized volumes measured ex vivo and the presence of hippocampal sclerosis, controlling for all other neuropathologies and the covariates listed in the Methods section (p<0.05, FDR-corrected). Unique colors have been assigned to different model estimates according to the color scale (units: 10−3 mm2). To enhance visualization, results are overlaid on in vivo T1-weighted images from a young subject with the same pre-segmented gray matter labels as those used in the present study, and the result for each label is shown in both brain hemispheres (no laterality information is presented in this figure; a single hemisphere per participant was investigated). Lateral and medial three-dimensional views of the same results are also shown.