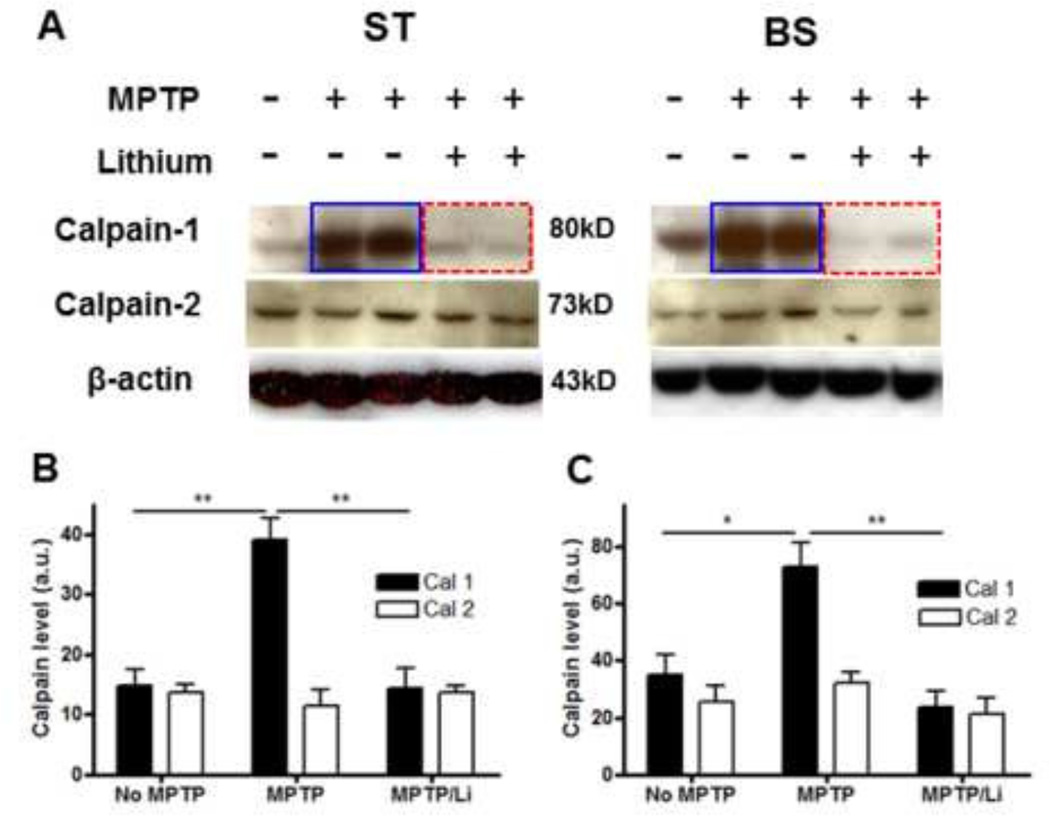
Figure 5.
Lithium suppresses MPTP-induced calpain 1 but not calpain 2 protein expression levels in both the ST and the BS. Examples of relative calpain 1 and 2 levels in Western blot analysis (A); density analysis was performed for the ST (B) and for the BS (C). Relative density is reported as mean ± SEM (n=4–6 in each group). *, p< 0.05, **, p < 0.01 versus controls as assessed by one-way ANOVA Tukey’s multiple comparison test.

