
Figure 3.
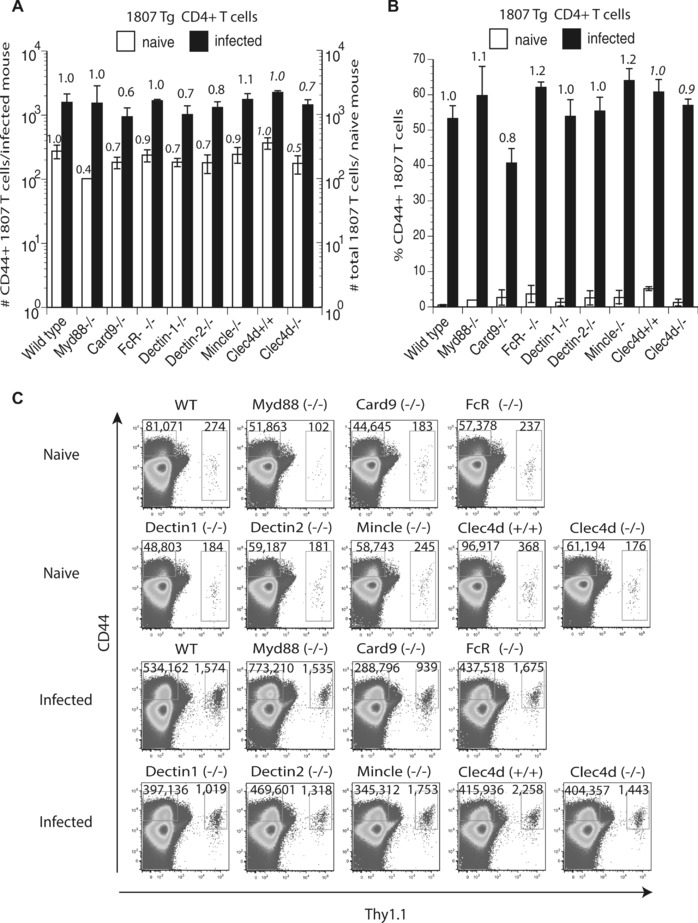
T‐cell activation and expansion is modestly regulated by Dectin‐1, Dectin‐2, MCL, and Card9. Wild type, Myd88−/−, Card9−/−, FcRγ−/−, Dectin‐1−/−, Dectin‐2−/−, Mincle−/−, and Clec4d+/+ and Clec4d−/− mice adoptively received 105 CD4+ purified, naïve 1807 Tg cells and were infected with 2 × 10⁶ live F. pedrosoi spores or not. At day 7 postinfection, the popliteal lymph nodes were harvested and the (A) number and (B) frequency of activated (CD44+) transferred 1807 (Thy1.1+) and endogenous CD4+ T cells was enumerated by flow cytometry. (A, B) The values over the bars in the histogram indicated the n‐fold change in T‐cell numbers versus the corresponding wild‐type control mice. (C) The dot plots show the sum of concatenated events from five mice per group and the values indicate the mean of endogenous and 1807 CD4+ T cells. Data are expressed as mean + SD of five mice per group from a single experiment representative of two independent experiments. The number and frequency of activated (CD44+) T cells was not statistically significant between infected knockout mice versus wild‐type controls using the Wilcoxon rank test for nonparametric data.