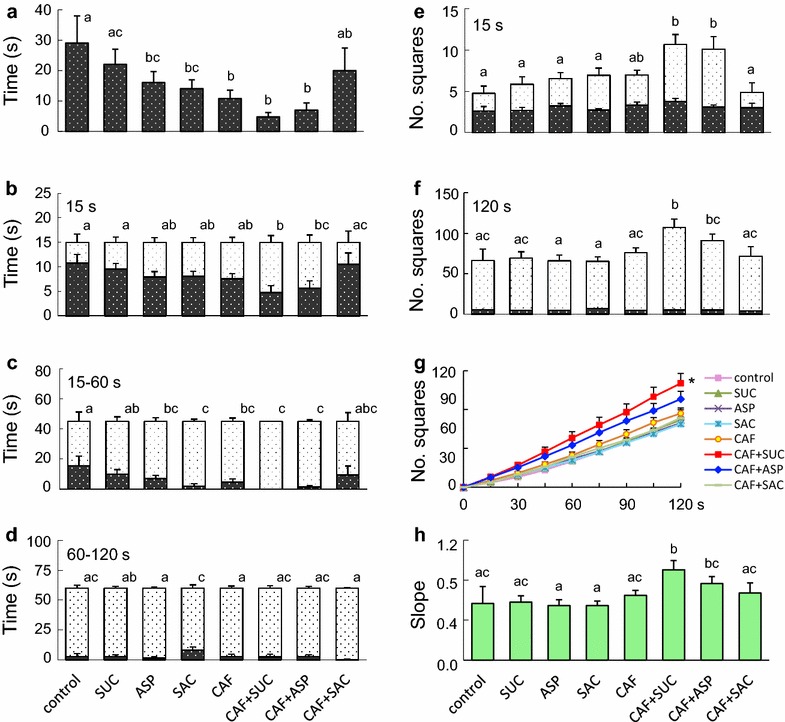
Fig. 3.

Results of the white-preference test from medaka hatchlings exposed to test substances during embryonic development. a Time lapse of the hatchlings crossing from the black to white area; b time distribution of hatchlings in the black and white areas during the first 15 s, c 15–60 s, and d 60–120 s; e number of squares hatchlings entered during the first 15 s and f the whole 120 s; g cumulative number of squares hatchlings entered during the 120 s test period; h slopes of the curves from (g). Different letters indicate significant differences, p < 0.05. Letters on the side of the columns in b–d are comparisons of the white areas, and those on top of the columns in e and f are comparisons of total number of squares. No letter was placed by the black areas in b–d because statistical analyses produced identical results to those of the white areas. In e and f, no significant difference was found among the black areas, while statistical analyses on the white areas produced identical results to those on the total numbers of squares. Values were expressed as mean ± SEM. *Significantly different from the control, p < 0.05. The abbreviations and concentrations of the substances are listed in Table 1
