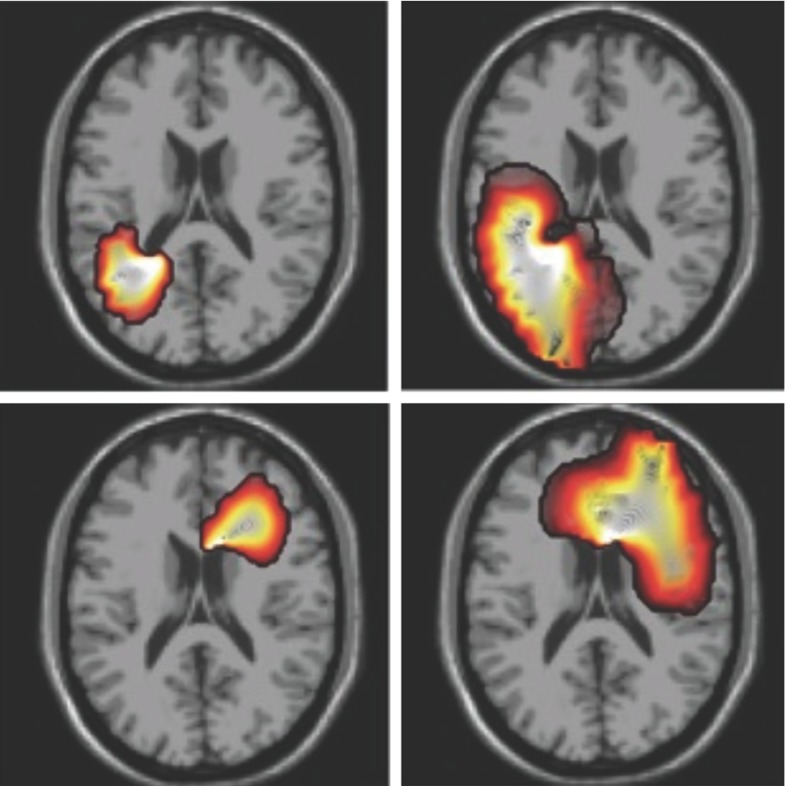
Fig. 13.
Simulation of glioblastoma multiforme at diagnosis and patient death, left and right columns. The black contour denotes the detectable tumor margin by computer tomography or magnetic resonance imaging. Colors indicate the gradient of malignant cell density with highest values at the center of the tumor and decreasing values toward the surrounding normal brain tissue, simulations by Gibin Powathil, University of Dundee

