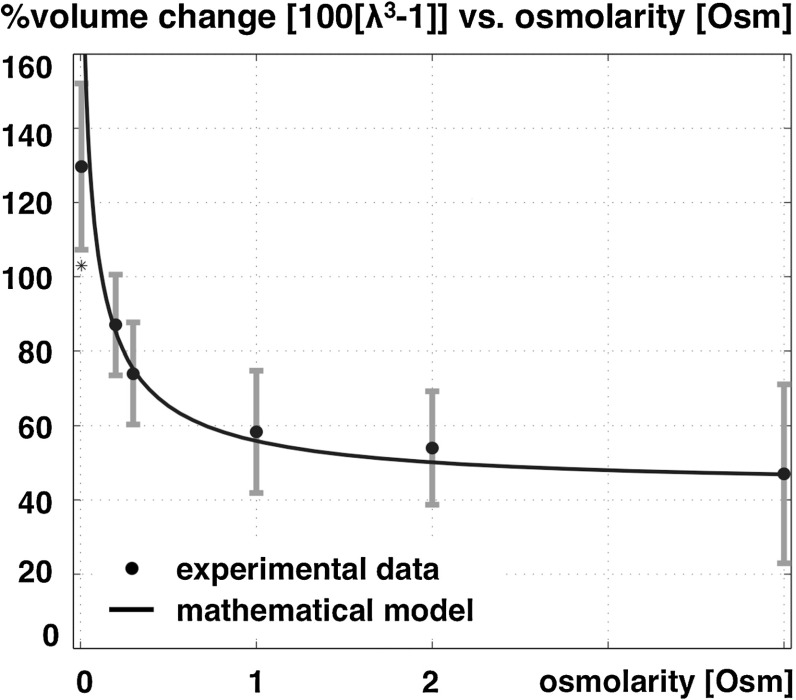
Fig. 8.
Experimental swelling data of tissue slice as a function of bath ionic concentration [data from (Elkin et al. 2010)] and curve fit of the volume change of dead rat brain tissue as a function of bath osmolarity. The error bars allude to the minimum and maximum range based upon the standard error of the mean, adapted from Lang et al. (2014)

