Fig. 14.

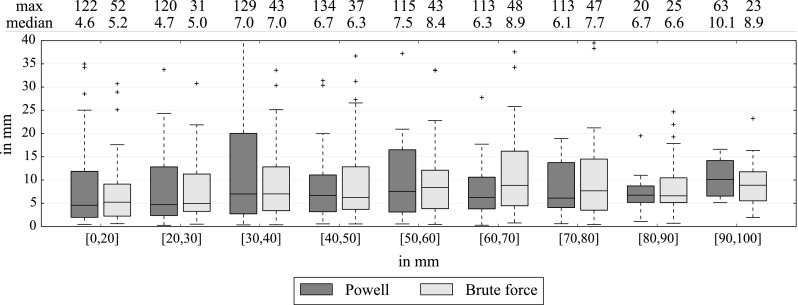
Average distance between paired vessels for all images (in mm) with optimal settings, 3 mm sampling and the complete 3DRA set. Paired vessels are grouped following their distance from the catheter tip (from 0 to 100 mm)

Average distance between paired vessels for all images (in mm) with optimal settings, 3 mm sampling and the complete 3DRA set. Paired vessels are grouped following their distance from the catheter tip (from 0 to 100 mm)