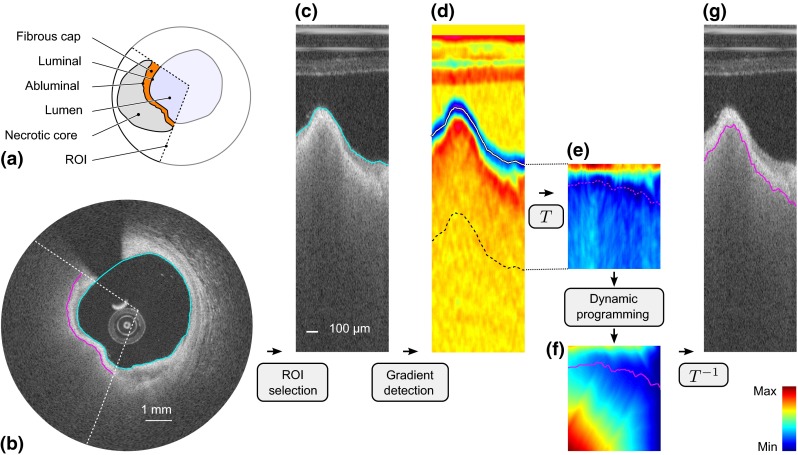
Fig. 1.

Segmentation framework. a Cartoon depicting the region of interest (ROI, dashed lines) encompassing the fibrous cap. b OCT image of an in vivo human coronary artery, in Cartesian coordinates, with the resulting luminal (cyan line) and abluminal (magenta line) segmentation contours. c ROI in polar coordinates, with the luminal contour (cyan line). d Gradient image . e Transformed cost image . f Cumulated cost , with the optimal path (magenta line). g Resulting abluminal segmentation contour
