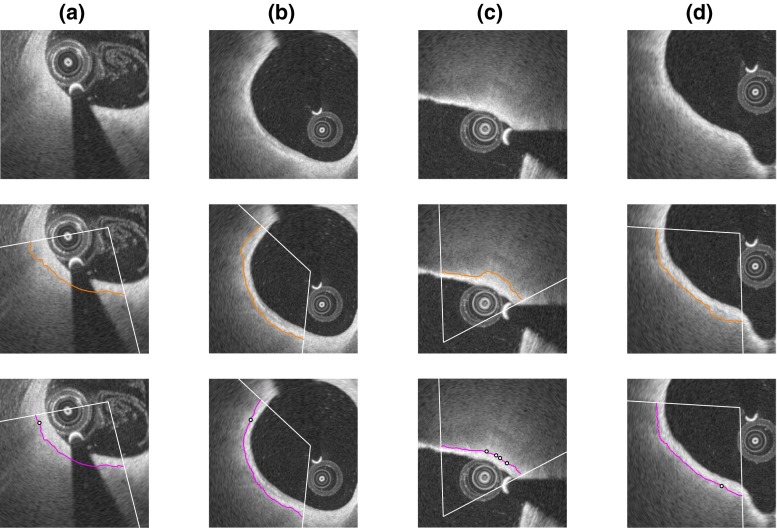
Fig. 6.
Example of manual contour correction, on four frames from different pullbacks. The top, middle, and bottom rows display the original image, the automatic segmentation contour of the fibrous cap (orange line), and the corrected segmentation contour (magenta line), respectively. In the bottom row, the control points that were manually indicated by the analyst are represented by the black dots

