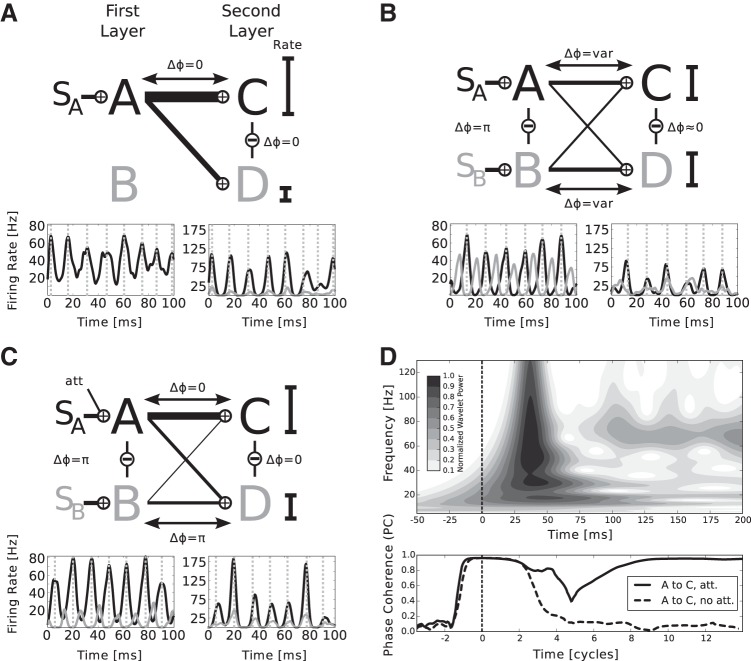
Fig. 2.
The mechanism of information routing and biased competition. The network architecture is symbolized by the simplified diagram in Fig. 1D. A: if 1 stimulus is present (here SA), both 2nd layer populations are entrained by the corresponding 1st layer population. The phase is suitable for information transfer and the mean rates of Cexc and Dexc, symbolized by the black bars, scale monotonously with the feed-forward connection probabilities. The width of the lines connecting the 1st and 2nd layer corresponds to total input to the 2nd layer over the respective connection. A, bottom: example traces of mean firing rates of the excitatory subpopulations, where the line color corresponds to the color of the populations in the model diagram. The dashed gray lines mark the peaks of oscillations in A. For better visualization, the firing rate traces in the 1st layer are shifted to account for transmission delay and the phase shift between incoming currents peaks and rate peaks in the 2nd layer, such that rate peaks in the 1st layer are aligned with the corresponding peaks caused in the 2nd layer. Please note that the phase differences are calculated between currents, as described in materials and methods and not mean population rates, which we show for the sake of clarity. B: adding the 2nd stimulus (here SB) brings Aexc and Bexc out of phase, whereas Cexc and Dexc tend to stay in-phase, due to the respective lateral interactions. The stimuli compete for representation in the 2nd layer. The outcome depends on temporal fluctuations in the peak rates of A and B. Thus the phases between the 1st and 2nd layer populations vary over time, favoring either A or B. Mean firing rates lie at approximately the mean of the 2 rates of C and D observed in A. C: symmetry is broken by adding an additional input representing the influence of attention. The higher rate of Aexc driven by the attended stimulus SA more likely entrains populations C and D and thus renders input from B ineffective. The mean firing rates of A, where only the attended stimulus is present, are partially recovered. D: transient dynamics of the network shown in the interval of −50 to 200 ms after stimulus onset. Top: wavelet power spectrum of the mean firing rate of population Cexc (attention on SA as in C), averaged over 100 trials. About 30 ms after stimulus onset (vertical dashed line), the population responds to the input with a strong, transient activation. Approximately 100 ms after stimulus onset, the population settles into a stable γ-rhythm with a frequency of ∼70 Hz. Bottom: amplitude of the phase coherence between Aexc and Cexc at a frequency of 70 Hz when SA is attended (solid black line) and when no attention is involved (dashed black line). The abscissa is given in units of 70-Hz cycles. At stimulus onset, there is a period of almost complete “synchrony” since the feed-forward input arrives in every trial at the same point in time and leads to the same initial activation. Subsequently, γ-oscillations begin to emerge in both populations, which are initially in a random phase relationship (dip around 5 cycles poststimulus onset), and then become more and more coherent in the case of attention on SA (solid line, after 9 cycles). Without attention, the phases remain on average in a random relationship leading to a low phase coherence amplitude.

