Fig. 8.

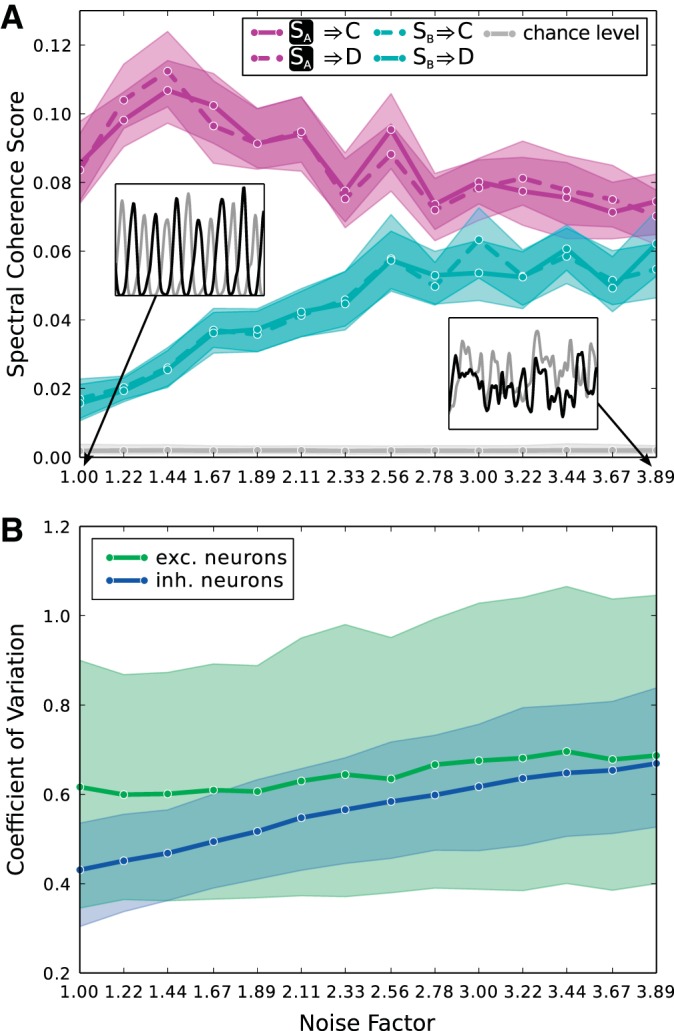
Robustness of information transmission to noise. A: noise in the system is increased by scaling all connection probabilities down and all synaptic weights up by the same noise factor. The plot shows the spectral coherence score for all 4 information transmission pathways for the case that both stimuli are present and SA is attended. The mixing parameter μ is set to 1. Selectivity of information transmission from the attended stimulus to the 2nd layer degrades with increasing noise factor. The main reason is that as the recurrent connectivity within inhibitory subpopulations decreases, determined by plocii, the γ-rhythms these populations generate get less and less stable. This fact is illustrated in the insets, which show example time courses of the mean activity of excitatory subpopulations in A (black) and B (gray) for noise factors of 1 and 3.89. B: coefficient of variation of interspike intervals of single neuron spike trains for all excitatory (green) and all inhibitory neurons (blue) in the network is displayed for various values of the noise factor. The solid lines denote mean values, and the shaded areas denote 75% confidence intervals. The increase of the coefficient of variation of inhibitory neurons correlates with the decreasing stability of generated γ-rhythms. Taken all neurons together, we observe coefficients of variation between ca. 0.35 and 1 over the whole range of the noise factor.
