
Figure 1.
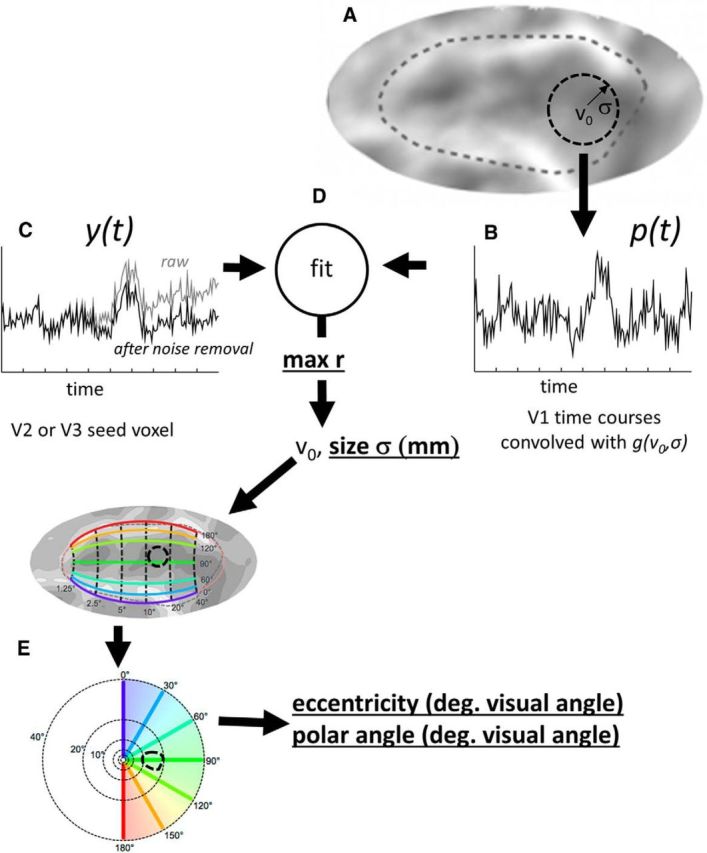
Schematic estimating the connective field for a seed voxel in V2 or V3. As described by Haak et al. (2013), assuming a linear relationship between blood-oxygenation levels and the fMRI signal, a predicted BOLD time course, p(t), can be calculated using a parametrized model of the connective field. A, The circular symmetric Gaussian model, g, is defined by its projection on a three-dimensional mesh representation of the boundary between the gray and white matter of the brain. Parameters consist of the Gaussian center location, v0 (in voxel coordinates) and the Gaussian spread, σ (in millimeters) across the folded cortical surface. B, The predicted BOLD time course, p(t), for any seed voxel is obtained by convolving the connective field, g(v0, σ), with the fMRI time course signals in V1. The connective field model parameters that best predict (C) the observed BOLD time course, y(t), are found by (D) maximizing the correlation coefficient between the prediction, p(t), and the observed time series, y(t). E, The parameter v0 is converted into visual space coordinates via the Benson template model of early visual areas (Benson et al., 2014). Parameters examined in this paper (r, σ, eccentricity, and polar angle) are bold underlined.