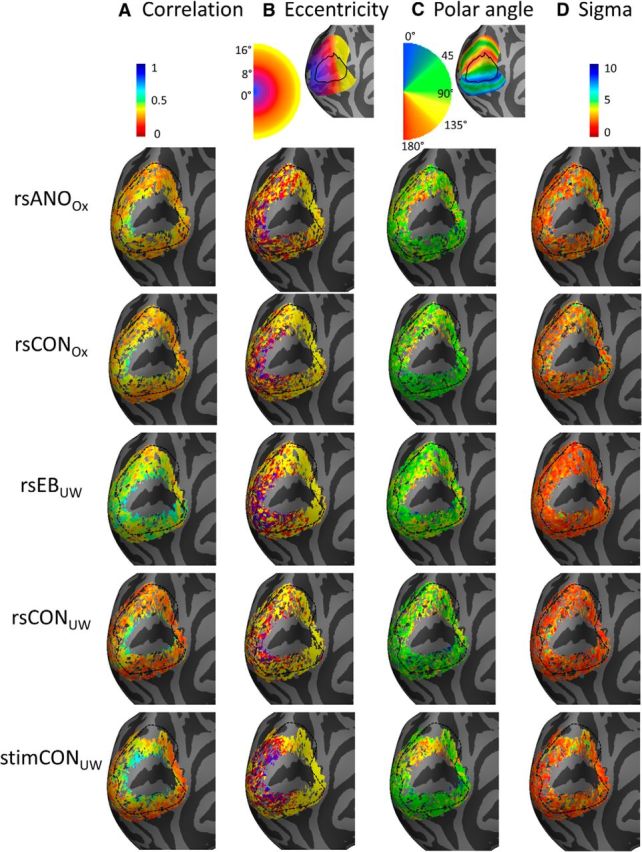
Figure 2.

Connective field parameters of interest for V2/V3 on the surface of the left hemisphere, averaged across all members of each subject group. The V2/V3 ROI used in analyses is shown as a dotted outline. Columns from left to right represent the following: (A) the correlation between predicted and obtained time courses, (B) estimated eccentricity, (C) estimated polar angle, and (D) estimated σ (connective field size, mm on the cortical surface). Rows represent parameter estimates for resting-state anophthalmic subjects (Oxford), resting-state normally sighted Oxford controls, early blind subjects (UW), resting-state normally sighted UW controls, and normally sighted UW controls viewing retinotopic mapping stimulus sequences. The legend shows color coding for each subject/hemisphere. Top insets, Expected mappings for eccentricity and polar angle within V2 and V3 based on the Benson et al. (2014) template, with V1 outlined in black.
