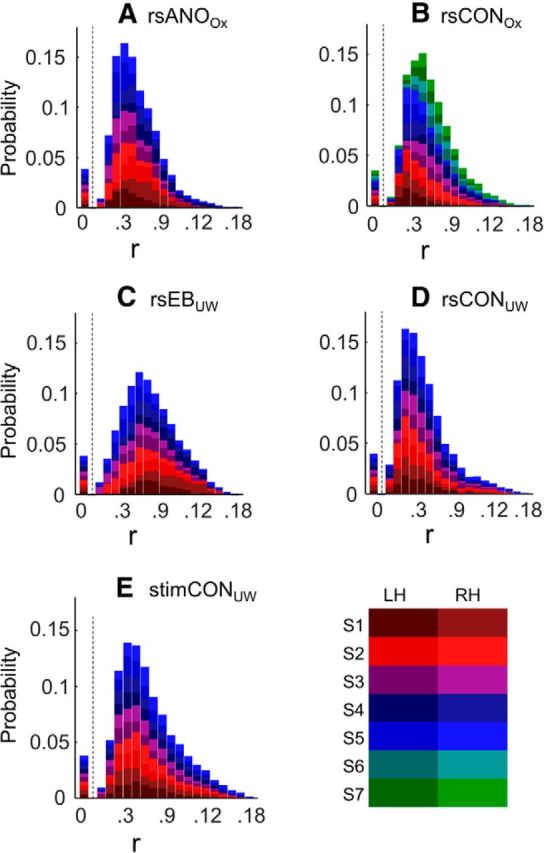
Figure 3.

Probability density distributions of connective field correlation coefficients (r). Each color in the stacked histogram represents a separate individual hemisphere. The legend shows color coding for each subject/hemisphere. The distribution of correlation coefficients for each hemisphere was normalized to sum to 1, so each hemisphere and subject contributes equally to the plot. Data are the following: (A) resting-state anophthalmic subjects (Oxford), (B) resting-state normally sighted controls (Oxford), (C) early blind subjects (UW), (D) resting-state normally sighted controls (UW), and (E) normally sighted controls (UW) viewing retinotopic mapping stimulus sequences.
