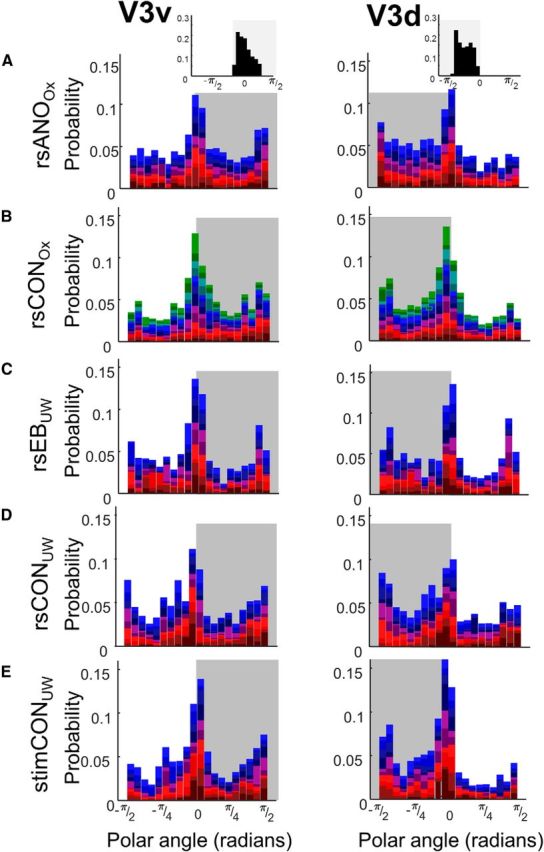
Figure 6.

Probability density distributions of connective field polar angle parameters for V3v and V3d. Data are the following: (A) resting-state anophthalmic subjects (Oxford), (B) resting-state normally sighted controls (Oxford), (C) early blind subjects (UW), (D) resting-state normally sighted controls (UW), and (E) normally sighted controls (UW) viewing retinotopic mapping stimulus sequences. Shaded regions represent polar angle boundaries for dorsal and ventral ROIs. Top insets, Expected probability distributions for polar angle within V2 and V3 based on the Benson et al. (2014) template.
