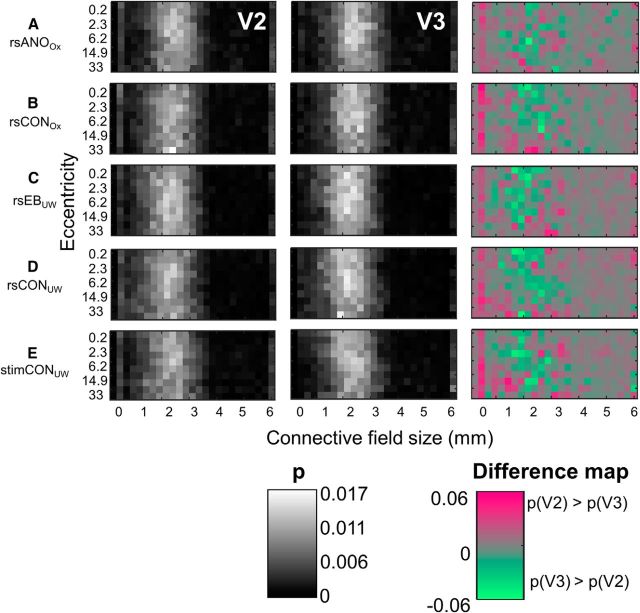
Figure 8.
Two-dimensional joint probability distributions (x-axis, connective field size; y-axis, eccentricity) of connective field size as a function of eccentricity for V2 and V3. Data are the following: (A) resting-state anophthalmic subjects (Oxford), (B) resting-state normally sighted controls (Oxford), (C) early blind subjects (UW), (D) resting-state normally sighted controls (UW), and (E) normally sighted controls (UW) viewing retinotopic mapping stimulus sequences. The third column represents the differences between the joint histograms of V2 and V3. For reasons of visualization, the range of connective field sizes is limited to 0°-6°.

