Figure 1.
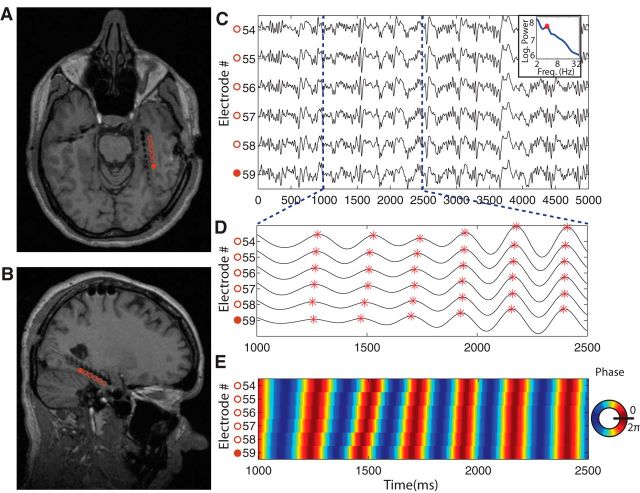
An example hippocampal traveling wave. A, Axial MRI of a patient who had electrodes implanted along the length of the hippocampus. Electrode locations are denoted by the black imaging artifacts. Colored circles are labels indicating correspondence between electrodes in A and C. B, Sagittal MRI from this same patient. C, Raw EEG theta waveform signal recorded for 5 s from 6 consecutive depth electrodes. The electrodes are ordered from anterior (top of plot) to posterior (bottom). D, Band-pass filtered (3–5 Hz) version of the EEG trace from C. Red asterisks denote the peaks of individual theta cycles. E, Color map plotting the filtered theta traces from D. Red denotes the peak of the oscillation and blue denotes troughs.

