
Figure 2.
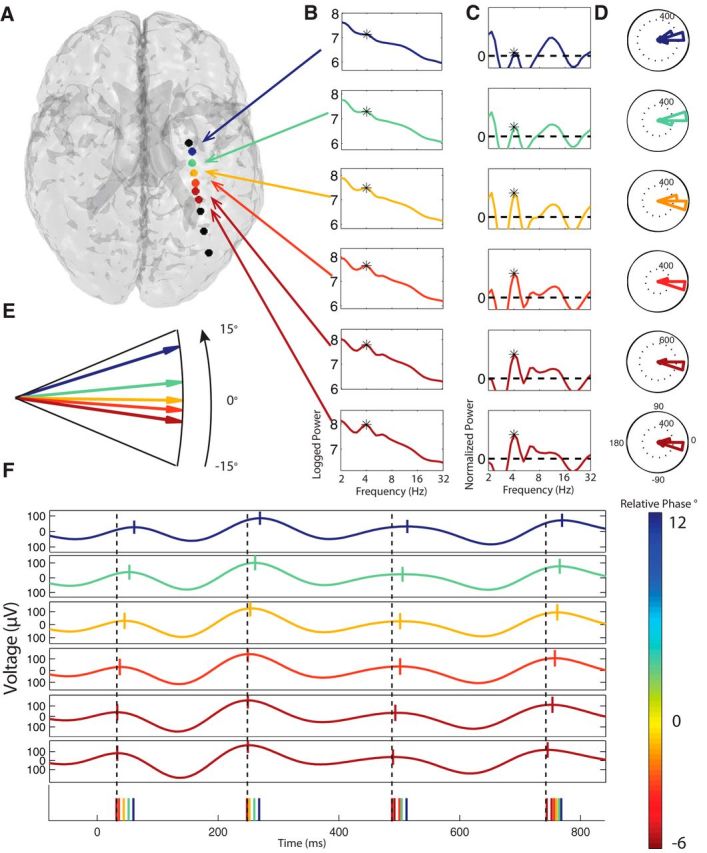
Example hippocampal ∼4 Hz traveling theta waves. A, Brain image depicting the locations of the depth electrodes implanted in Patient 3. Colored circles denote electrodes. For each electrode in a theta cluster (see Materials and Methods), color indicates the relative phase of the oscillation at that electrode (see color bar in bottom right). Black denotes electrodes where theta was not observed. From top to bottom, electrodes 1, 2, 3, and 4 were manually localized to the hippocampus. B, Power spectra at electrodes where significant theta-band oscillations were observed. Black asterisk denotes the frequency with significant theta narrowband oscillations. C, Normalized power spectra, computed by removing the 1/f background signal from the power spectra in B. D, Histogram of the relative phases of theta oscillations measured from each electrode across trials. Phase moves in a counterclockwise direction in these plots, so each theta cycle is first encountered at the electrode at the bottom of the plot (negative relative phase) and last reaches the electrode at the top of the plot (positive relative phase). E, Phase detail plot indicating the relative phase of each electrode's theta oscillation. Colored arrows indicating an orderly progression of phase from the most posterior (red) to the most anterior electrode. F, Example EEG traces from each electrode. Vertical ticks denote the peak phase. Black dotted line is a reference indicating the time point of the phase of the bottom (most posterior) electrode. Bottom row of the plot illustrates the time points when each electrode reached its peak phase. The ordering of the colored ticks indicates the relative time points when each electrode exhibited a theta peak.