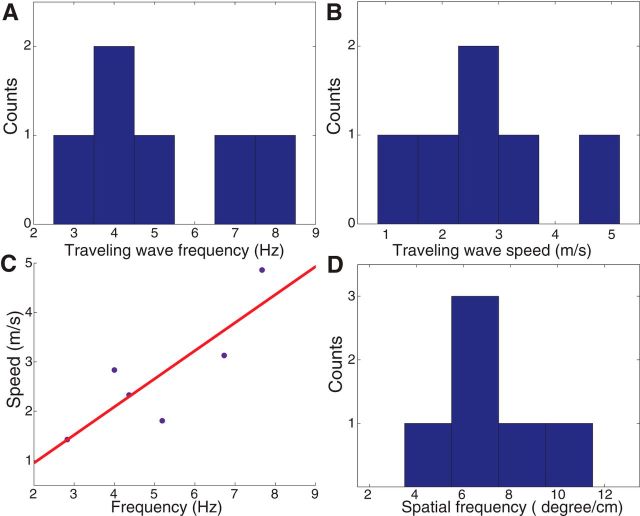
Figure 4.
Population analysis of hippocampal traveling waves. A, Histogram of the frequency of each traveling theta wave. B, Speeds of traveling theta waves moving through the hippocampus. All waves traveled in a posterior–anterior direction. C, Scatter plot indicating the relation between traveling-wave frequency and speed. Red line indicates a best-fit regression line. D, Histogram of the spatial frequencies of hippocampal traveling theta waves.

