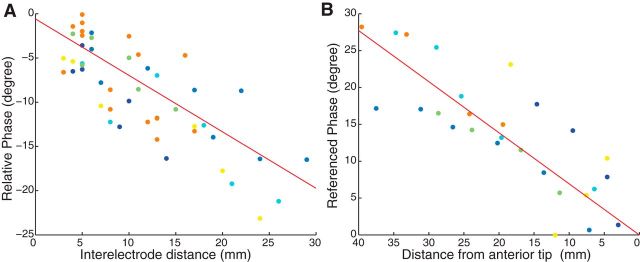
Figure 5.
Analysis of relative theta phase across the hippocampus. A, Theta-phase differences across all pairs of electrodes within each theta traveling wave. Each point depicts a single electrode pair, with color distinguishing electrodes from separate patients. The horizontal coordinate indicates the distance between the electrodes in the pair. The vertical coordinate indicates the phase differences observed for the theta oscillations at each electrode. Negative phases denote that theta phase progresses in a posterior–anterior direction. Red line denotes the best fit regression line. B, Normalized theta phase at each electrode where a traveling hippocampal theta wave was observed. Each point denotes one electrode. The horizontal coordinate indicates the electrode's distance to the anterior tip of hippocampus in Talairach space. The vertical coordinate indicates the electrode's estimated phase difference relative to the tip of the hippocampus (see Materials and Methods). Red line denotes the best fit regression line.

