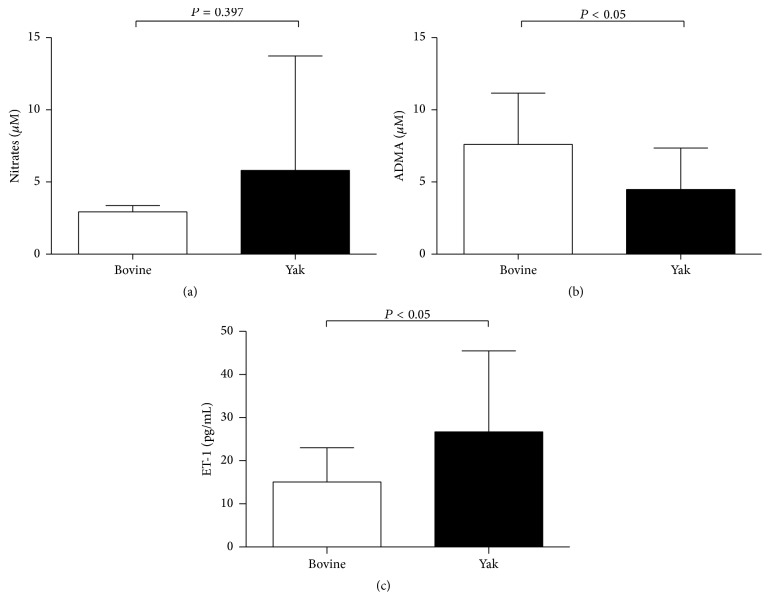
Figure 1.
Nitrates, ADMA, and endothelin-1 (ET-1) concentrations of plasma from yaks and bovines. Nitrate concentration, measured by Griess method, showed no significant differences between yaks (n = 12) and bovines (n = 6) (a). ADMA concentration, measured by ELISA, was significantly lower in yaks (n = 19) than bovines (n = 11) (b), and ET-1 concentration was significantly higher in yaks (n = 13) than bovines (n = 10) (c). Data are expressed as mean ± SD. ∗ P < 0.05 versus bovine.

