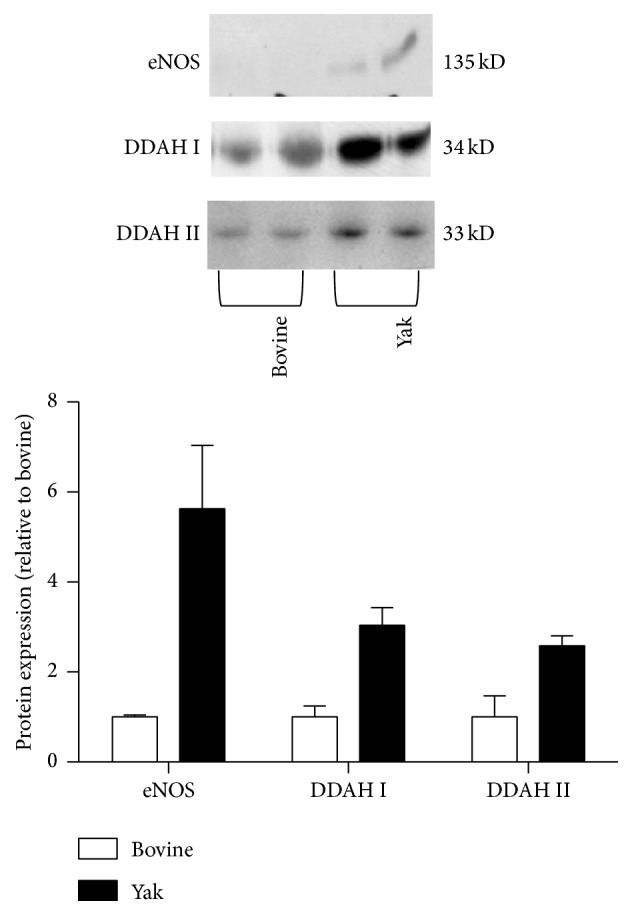
Figure 2.

Western blot analysis of eNOS, DDAH I, and DDAH II protein in lungs from yaks and bovines. The photomicrograph shown is a representative image from the experiments, and the bar graph shows the density ratios of eNOS, DDAH I, and DDAH II protein bands relative to those from bovines. The eNOS, DDAH I, and DDAH II protein expression was apparently increased in lungs from yaks compared with those from bovines. Data are expressed as mean ± SD (n = 2).
