
Figure 5.
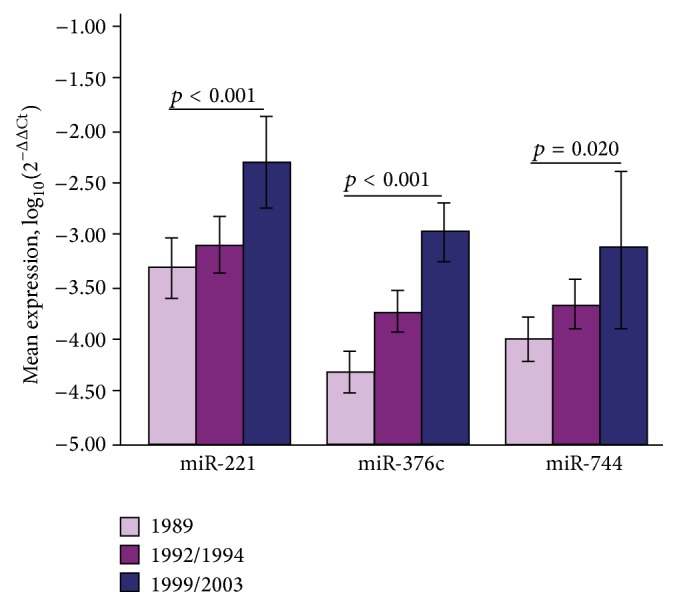
Marked increasing expression of miR-221, miR-376c, and miR-744 over time in 20 GC cases during 15-year (1989–2003) follow-up period. Error bars represent 95% CI (taken with permission from [103]).
Official websites use .gov
A
.gov website belongs to an official
government organization in the United States.
Secure .gov websites use HTTPS
A lock (
) or https:// means you've safely
connected to the .gov website. Share sensitive
information only on official, secure websites.
Marked increasing expression of miR-221, miR-376c, and miR-744 over time in 20 GC cases during 15-year (1989–2003) follow-up period. Error bars represent 95% CI (taken with permission from [103]).