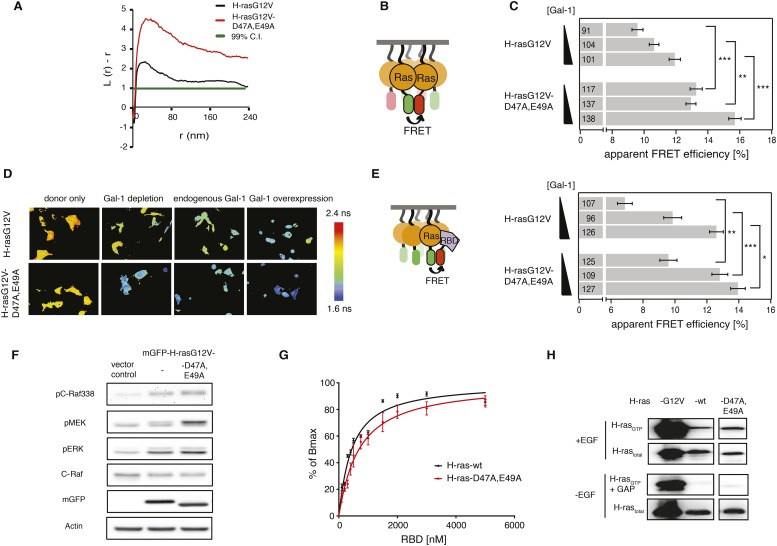
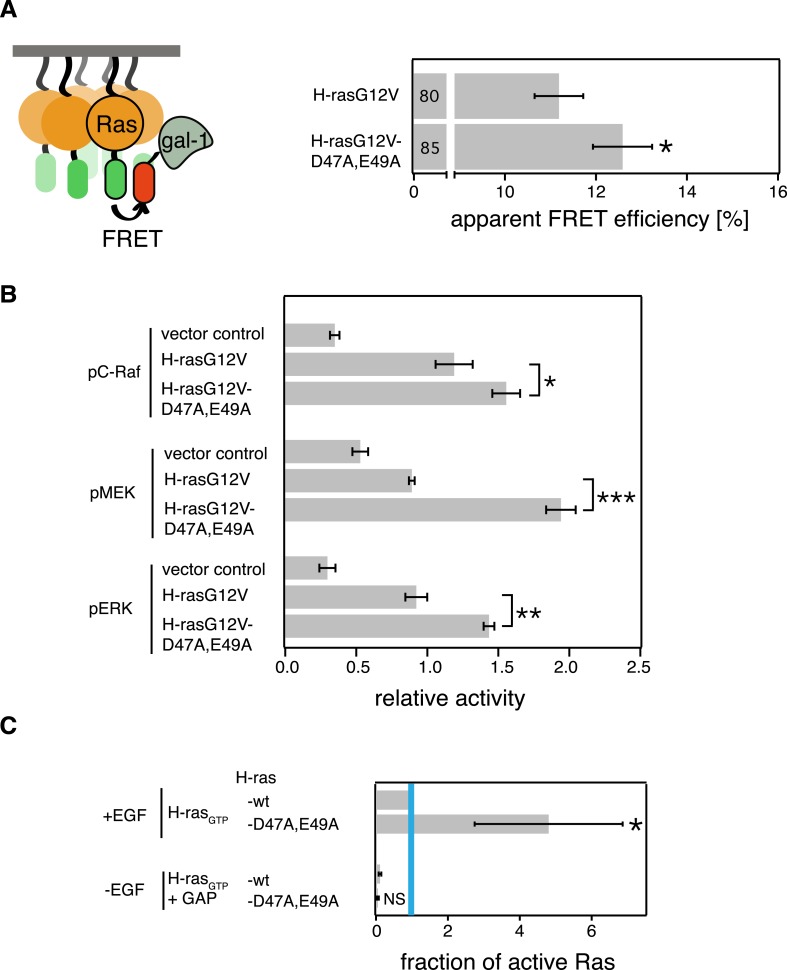
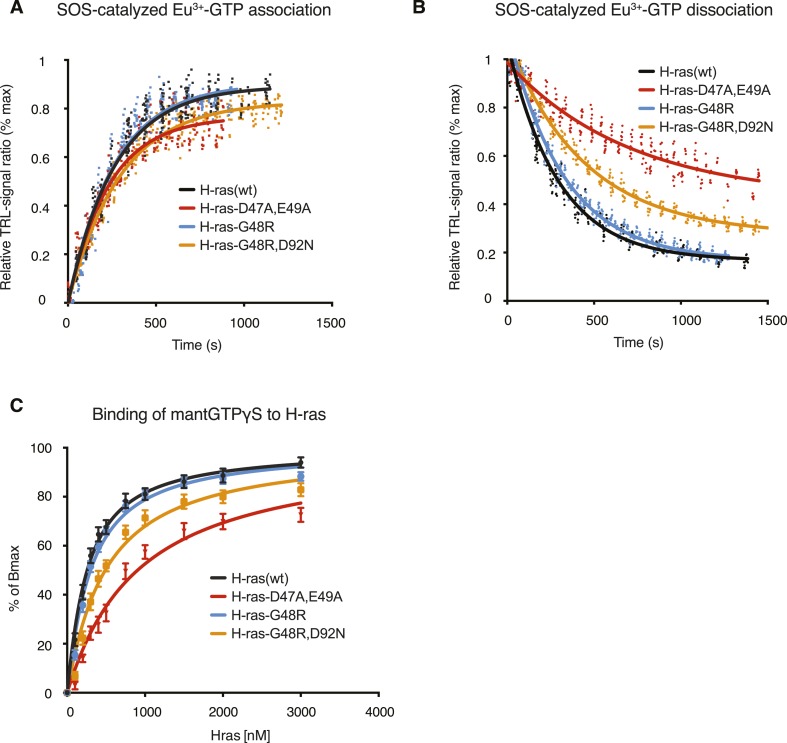
Figure 2. Computational modeling-derived switch III mutations D47A,E49A in H-ras increase nanoclustering and RBD-recruitment.
(A) Electron microscopic nanoclustering analysis of mGFP-H-rasG12V and mGFP-H-rasG12V-D47A,E49A in BHK cells. Normalized univariate K-functions, where maximal L(r)-r values above the 99% CI for complete spatial randomness indicate clustering at that value of r (number of membrane sheets analyzed per condition, n = 17). (B) Schematic representation of nanoclustering-FRET analysis, where mGFP-tagged and mCherry-tagged Ras constructs were co-expressed in cells. (C) The nanoclustering-FRET response of H-rasG12V-D47A,E49A and its parent construct in dependence of the dose of the nanocluster scaffold Gal-1 in BHK cells. (D) Representative nanoclustering-FRET fluorescence lifetime images of BHK cells expressing FRET-pairs (or donor only, left column) of constructs indicated on the left, under Gal-1 conditions as annotated on the top. Color look up table to the right shows fluorescence lifetimes. (E) RBD-recruitment FRET data of H-rasG12V-D47A,E49A and its parent construct at three different Gal-1 doses analyzed using FRET-imaging of transiently transfected BHK cells. (C, E) Numbers in bars give numbers of analyzed cells from three independent experiments. Error bars represent the standard error of the mean (±SEM). Statistical analysis vs parent RasG12V was performed as described in ‘Materials and methods’ (*p < 0.05; **p < 0.01; ***p < 0.001). (F) Western blot analysis of C-Raf, MEK, and ERK phosphorylation and C-Raf in BHK cells transiently expressing mGFP-H-rasG12V-D47A,E49K, its parent or an empty vector control. Equal expression of Ras constructs can be seen in the mGFP row, equal loading in the Actin row. (G) In vitro RBD binding to mant-GTPγS loaded wild-type (wt) H-ras or H-ras-D47A,E49A measured with a fluorescence anisotropy assay. Details on the fitting function are in the ‘Materials and methods’. Data are averages ±SEM of three repeats. (H) RBD-pulldown experiments in BHK cells transiently expressing indicated H-ras mutants or wt H-ras. Top panel shows level of active Ras after EGF-stimulation (100 ng/ml). Bottom panel shows GAP sensitivity of wt and mutant H-ras proteins. See also Figure 2—figure supplement 1 and Figure 2—figure supplement 2.


