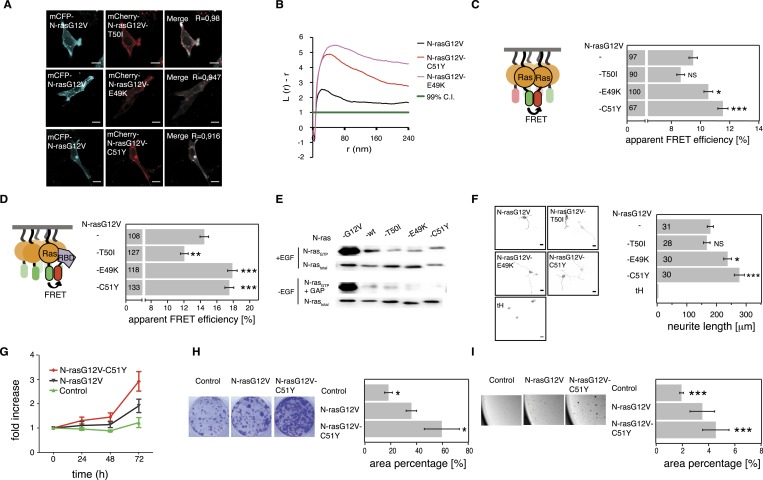
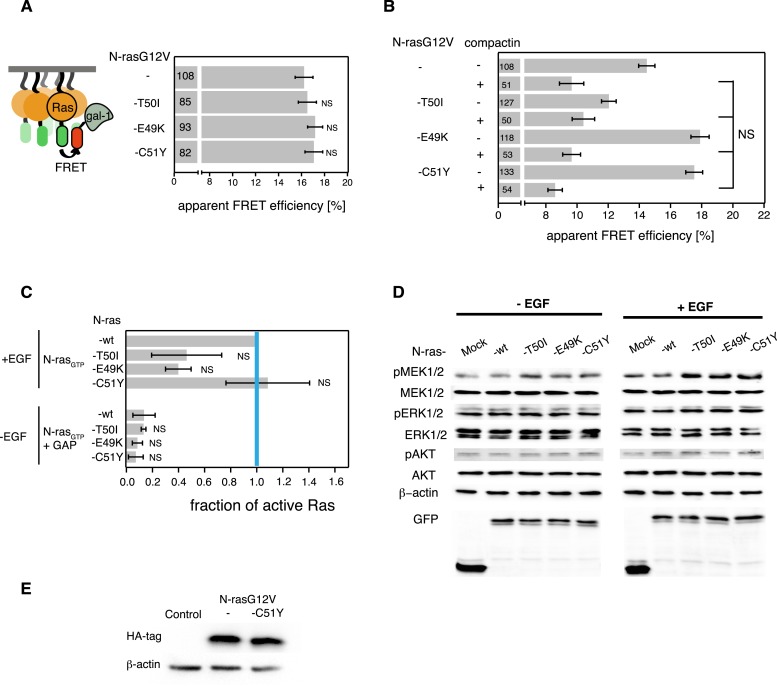
Figure 5. Tumor-derived N-ras switch III mutations increase cell proliferation and transforming activity by increased nanoclustering.
(A) Representative confocal images of mCFP-N-rasG12V co-localization with the switch III mutants mCherry-N-rasG12V-T50I, mCherry-N-rasG12V-E49K, or mCherry-N-rasG12V-C51Y in BHK cells. The Manders' coefficient (R) that quantifies co-localization is marked on the merged images. Scale bar is 10 μm. (B) Electron microscopic nanoclustering analysis of mGFP-tagged N-ras mutants in BHK cells. Normalized univariate K-functions, where maximal L(r)-r values above the 99% CI for complete spatial randomness indicate clustering at that value of r (number of membrane sheets analyzed per condition, n > 17). (C) Nanoclustering-FRET analysis of cancer-associated N-rasG12V-T50I, N-rasG12V-E49K and N-rasG12V-C51Y as compared to their parent construct in BHK cells. (D) RBD-recruitment FRET analysis of N-rasG12V-T50I, N-rasG12V-E49K, and N-rasG12V-C51Y as compared to their parent construct in BHK cells. (E) RBD-pulldown experiments in BHK cells transiently expressing indicated N-ras mutants or wild-type (wt) N-ras. Top panel shows level of active N-ras after EGF-stimulation (100 ng/ml). Bottom panel shows GAP-sensitivity of wt N-ras and mutant N-ras proteins. (F) MAPK-dependent PC12-differentiation assay. PC12 cells transiently expressed indicated mGFP-tagged N-rasG12V with or without switch III mutations, or the control tH (minimal membrane anchor of H-ras) for 48 hr. Subsequently neurite length was assessed (right). Examples of confocal images of PC-12 cells expressing indicated constructs used for neurite length quantification (left). Scale bar is 15 μm. (C, D, F) Numbers in bars give number of analyzed cells from three independent experiments. Error bars represent the standard error of the mean (±SEM). Statistical analysis vs parent RasG12V was performed as described in the ‘Materials and methods’ (NS, non-significant; *p < 0.05; **p < 0.01; ***p < 0.001). (G) Proliferation of NIH/3T3 cells stably expressing N-rasG12V, N-rasG12V-C51Y, or a control construct. Control is transduced with the GFP reporter only. Error bars represent the standard error of the mean (±SEM). (H) Transformation of NIH/3T3 cells stably expressing N-rasG12V as compared to N-rasG12V-C51Y or a vector-only control. Foci formed after 7 days of growth were stained with crystal violet and mean (±SEM) foci areas from three biological repeats were quantified (right). Representative images of crystal violet-stained foci of transduced NIH/3T3 cells (left). (I) Anchorage-independent growth of NIH/3T3 cells stably expressing N-rasG12V as compared to N-rasG12V-C51Y or a vector-only control. Colonies were imaged after 14 days (left), and the colony area was determined (right). Three independent biological repeats were performed and each repeat was done in triplicate. Error bars represent the standard error of the mean (±SEM). See also Figure 5—figure supplement 1.


