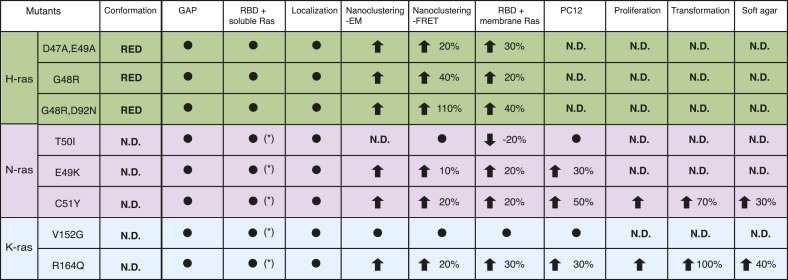
Figure 7. Summary table of Ras switch III mutant properties studied in this work.
The table summarizes major experimental results obtained in different assays that were used to characterize switch III mutants of H-ras (highlighted in green), N-ras (violet), and K-ras4B (blue). Note that in addition extensive biochemical characterization data of the H-ras mutants can be found in Supplementary file 1. Black circle dot indicates that no significant change was observed. Black arrows represent significant increase (up) or decrease (down) of quantified parameters as compared to the parent RasG12V control. The percentage of these changes is given in addition. The following columns (italics) report on: Conformation—predicted H-ras mutant conformation, according to Figure 1A; GAP—sensitivity of mutants to GAP-stimulated GTP hydrolysis; RBD + soluble Ras—binding of the C-Raf-RBD to Ras mutants in solution, which was either measured by fluorescence anisotropy with purified proteins or in BHK cells treated with compactin using FRET (annotated with *); Localization—change in colocalization of mutants relative to their parent constructs in BHK cells determined by confocal microscopy; Nanoclustering-EM—changes in Ras nanoclustering obtained by electron microscopy or -FRET in BHK cells; RBD + membrane Ras—binding of the C-Raf-RBD to Ras mutants in BHK cells measured by FRET; PC12—results of PC12-cell neurite outgrowth assay; last three columns report on Ras-mutant transformed NIH/3T3 cell proliferation, focus formation (transformation) and anchorage-independent growth (soft agar).

