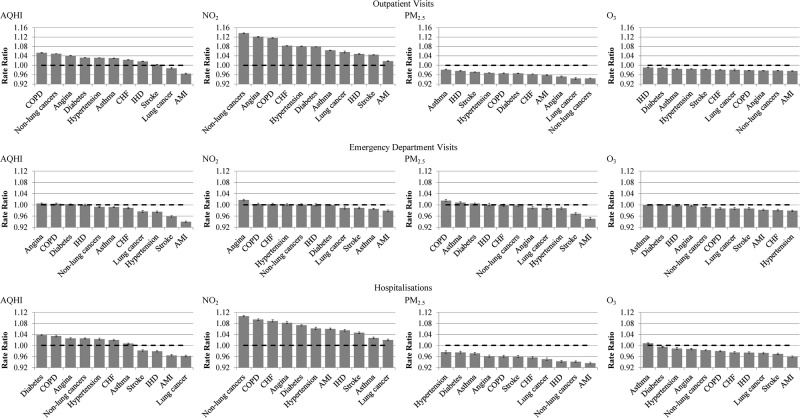
Figure 1.
Risk* of health services use by pollutants on day 0 of exposure: AQHI, NO2, PM2.5 and O3. * The Rate Ratios were obtained from Poisson Regressions and these correspond to increase/decrease in risk of the respective health services use per unit increase in AQHI and per 10-unit increase in each of NO2, PM2.5 and O3. All Rate Ratios were adjusted for age groups, sex, day of the week, temperature, seasons, years, Local Health Integration Network and income quintiles. Error bars represent 95% CIs.

