
Figure 1. Expected and observed values of the dilution series.
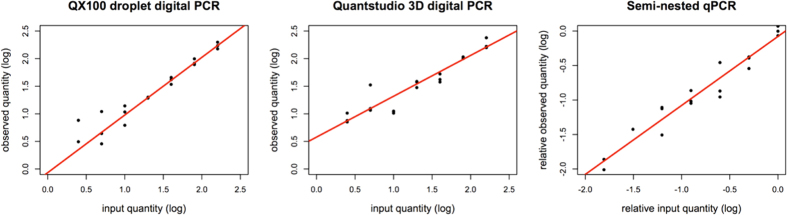
Input quantity plotted against the observed quantities of the dPCR platforms and against the Cq-values of the qPCR. Robust regression analysis reveals a quantitative efficiency of 104.5% for the QX100, 74% for the Quantstudio and 93.64% for the qPCR. Quantitative linearity is R2 = 0.85 for the QX100, R2 = 0.78 for the Quantstudio and R2 = 0.83 for the qPCR.