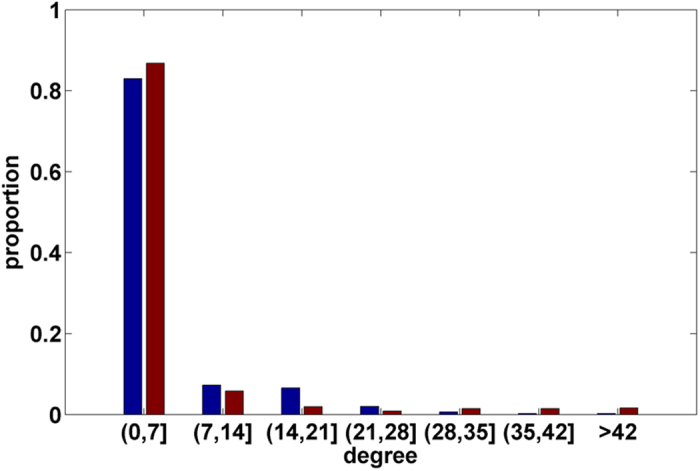
Figure 1. Degree distribution of drug and target.

The blue bars indicate the degree distribution of the drug, and the red bars indicate the degree distribution of the target.

The blue bars indicate the degree distribution of the drug, and the red bars indicate the degree distribution of the target.