
Figure 6. Changes in heart rate throughout the experimental sessions.
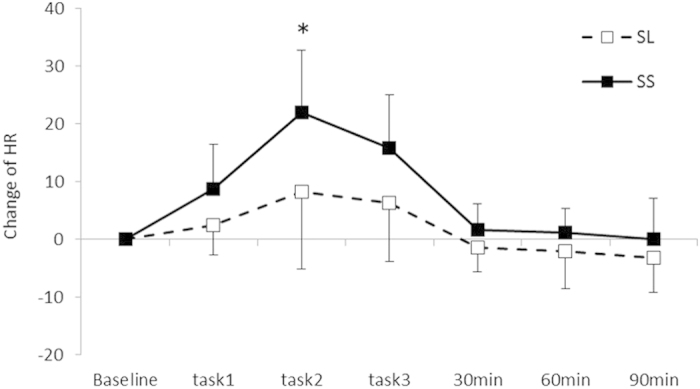
Error bars indicate the standard error of the mean. *Significant differences from the baseline value for each group (p < 0.05).
Official websites use .gov
A
.gov website belongs to an official
government organization in the United States.
Secure .gov websites use HTTPS
A lock (
) or https:// means you've safely
connected to the .gov website. Share sensitive
information only on official, secure websites.
Error bars indicate the standard error of the mean. *Significant differences from the baseline value for each group (p < 0.05).