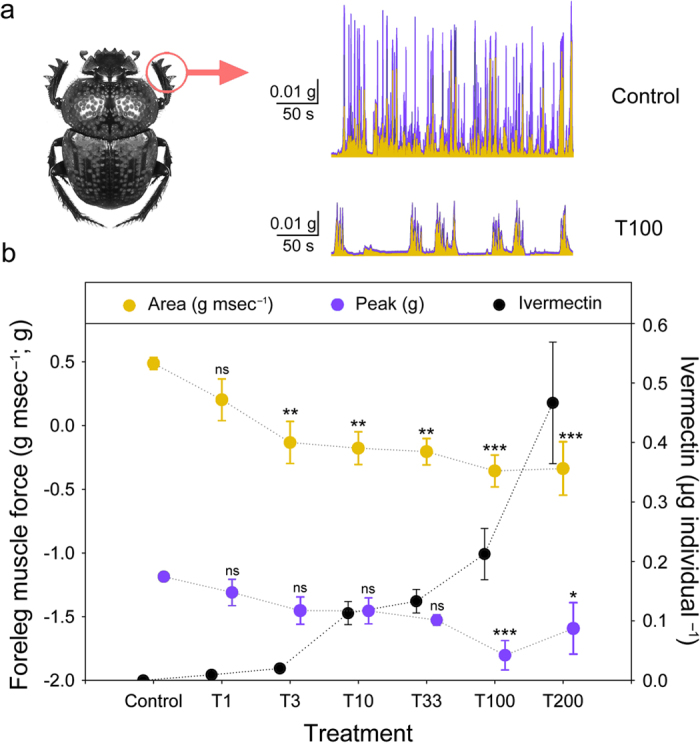
Figure 2. Ivermectin decreases the muscle force of Scarabaeus cicatricosus.

(a) Spontaneous isometric muscle contraction recordings of an ivermectin-free individual (control) and an individual treated with application of ivermectin in dung (100 μg kg–1 dung (fresh weight)). (b) Mean ( ± s.e.m.) data showing the effect of different ivermectin doses on foreleg muscle force. The treatments correspond to 1.0, 3.3, 10.0, 33.3, 100.0, and 200.0 μg kg–1 dung (fresh weight) plus an untreated control. Yellow dots correspond to the area of spontaneous force generation above the resting level during a time interval of 5 minutes (in g ms–1); purple dots correspond to the peak (maximum value of spontaneous force; in g) during a time interval of 5 minutes (data are log10 transformed means ± s.e.m.; see text for statistical results); black dots correspond to the ivermectin ingested for each treatment (data are means ± s.e.m.; *P < 0.05, **P < 0.01, ***P < 0.001, post-hoc Dunnet’s test). Photo credit: José R. Verdú.
