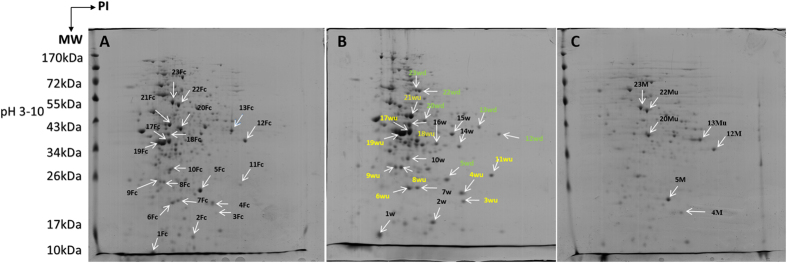
Figure 4. Representative 2DE profile of cellular proteins of P. indica in isolation or in co-culture with WR5 and M4 strains of A. chroococcum.

Proteins from Control (A), WR5-treated (B) and M4-treated (C) cultures were separated by isoelectric focusing on linear IPG strips and run on 12% polyacrylamide SDS gel; numbers of differentially expressed spots correspond to protein identified by MALDI-TOF/MS and are listed in Tables 1 and 2.
