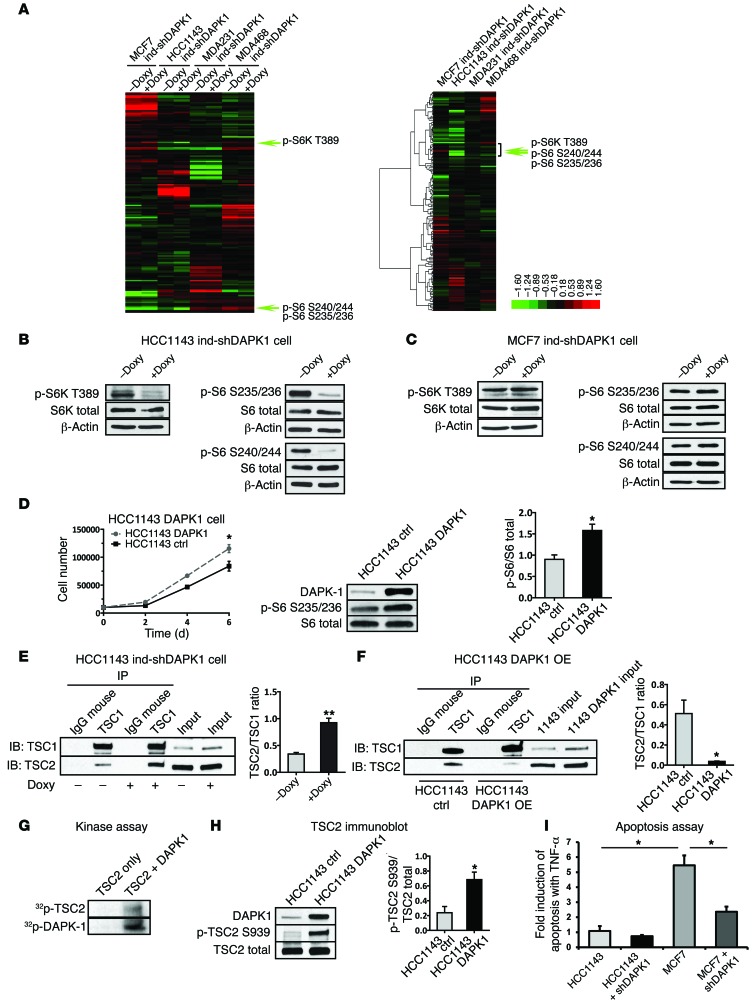
Figure 6. RPPA analysis identifies DAPK1 as a modulator of mTOR pathway.
RPPA analysis was performed using triplicate samples of MCF7, HCC1143, MDAMB 231, and MDAMB 468 cells with inducible DAPK1 knockdown capacity. (A) Heat maps of protein level (left panel) and protein level change (middle panel) in cells before (–Doxy) and after (+Doxy) DAPK1 knockdown. (B) Level of phospho-S6 at Ser235/236 and Ser240/244 and of phospho-S6K at T389 before and after DAPK1 knockdown in HCC1143 cells. (C) Expression of phospho-S6 at Ser235/236 and Ser240/244 and of phospho-S6K at T389 before and after DAPK1 knockdown in MCF7 cells. (D) Growth and levels of phospho-S6 at Ser235/236 in HCC1143 ctrl and DAPK1 overexpression cell lines. Western blot analysis was done 3 times. A representative blot and quantification of phospho-S6/S6 ratio are shown. (E) Co-IP of TSC1/TSC2 complex using TSC1 antibody in HCC1143 before and after DAPK1 knockdown. This experiment was done 3 times. A representative IP Western blot and quantification of TSC2/TSC1 ratio are shown. (F) Co-IP of TSC1/TSC2 complex using TSC1 antibody in HCC1143 before and after DAPK1 overexpression. This experiment was done 3 times. A representative IP Western blot is shown, and quantification of the TSC2/TSC1 ratio is shown. (G) Phosphorylation of TSC2 by DAPK1 in in vitro kinase assay. (H) Level of phospho-TSC2 at Ser939 in HCC1143 control and HCC1143 DAPK1 overexpression cell lines. All lysates were collected 4 days after treatment. Western blot was performed 3 times. A representative blot and quantification of phospho-TSC2/TSC2 are shown. (I) Fold induction of apoptosis in HCC1143 (p53-mutant) and MCF7 (p53-WT) cells treated with 50 ng/ml TNF-α for 48 hours, measured by FACS analysis of annexin V/PI staining. Cell lines were either shEmpty vector control or shDAPK1-induced, as indicated. Each data point represents 3 technical replicates, with results reported as average ± SEM. *P < 0.01; **P < 0.001, 2-tailed Student’s t test.

