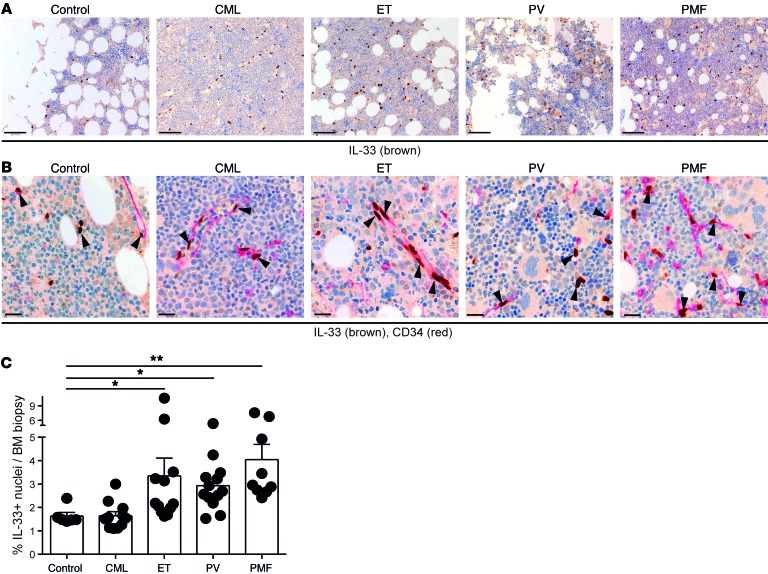
Figure 7. Increased levels of IL-33 protein in trephine biopsies of MPN patients.
IHC for (A) IL-33 (brown) (scale bar: 100 μm) and for (B) IL-33 (brown) and CD34 (red) in normal and MPN BM (scale bar: 20 μm). (C) Percentage of IL-33–positive nuclei in BM of controls (n = 6) and of patients newly diagnosed with the indicated hematopoietic malignancies. CML (n = 11), ET (n = 12), PV (n = 13), and PMF (n = 9). Data are mean ± SEM. Kruskal-Wallis with Dunn’s post hoc test was used; control biopsies were compared with all other groups. *P < 0.05; **P < 0.01.

