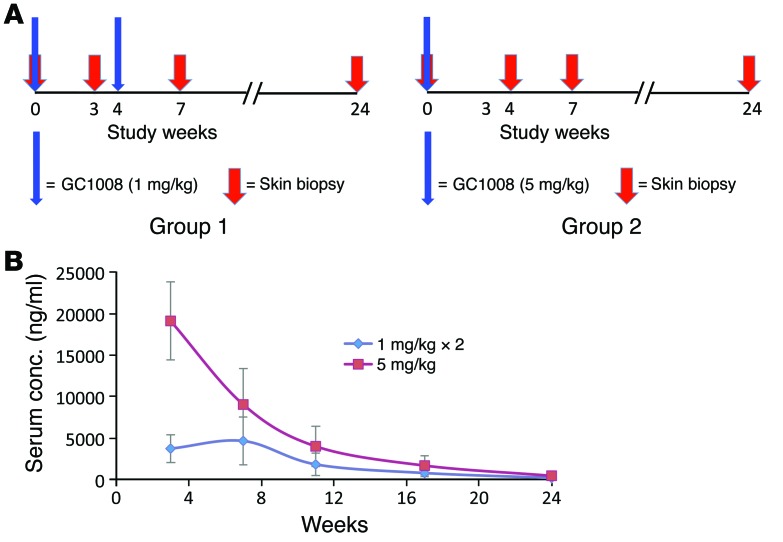
Figure 2. Study design and pharmacokinetics of fresolimumab in two dosing groups.
(A) Trial protocol for each group shows dosing levels and frequency and timing of skin biopsies. Red arrows indicate skin biopsies. (B) Fresolimumab levels measured in sera at 3, 7, 11, 17, and 24 weeks in group 1, which received 2 doses of 1 mg/kg at weeks 0 and 4 (blue diamonds), and group 2, which received a single dose of 5 mg/kg fresolimumab at week 0 (red squares). Error bars indicate SD.

