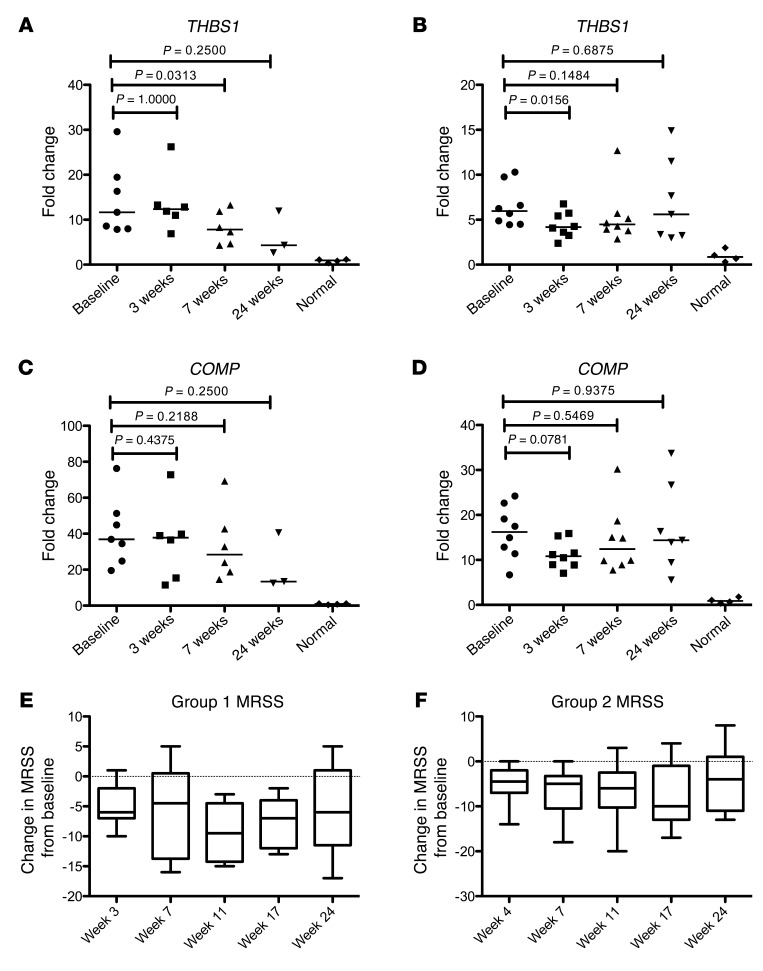
Figure 3. Changes in biomarker gene expression and MRSS by study group.
(A and B) THBS1 and (C and D) COMP gene expression and (E and F) MRSS from study patients in (A, C, and E) group 1 (n = 7), which received 2 doses of 1 mg/kg fresolimumab, and (B, D, and F) group 2 (n = 8), which received 1 dose of 5 mg/kg fresolimumab. Dot plots show median (horizontal bars) and statistical significance of THBS1 and COMP gene expression (Wilcoxon signed-rank test, using available data). Box plots show median (horizontal line), interquartile (box), and 95% confidence limits (whiskers) of MRSS. Line graphs showing changes in individual patients over time are shown in Supplemental Figure 1.

