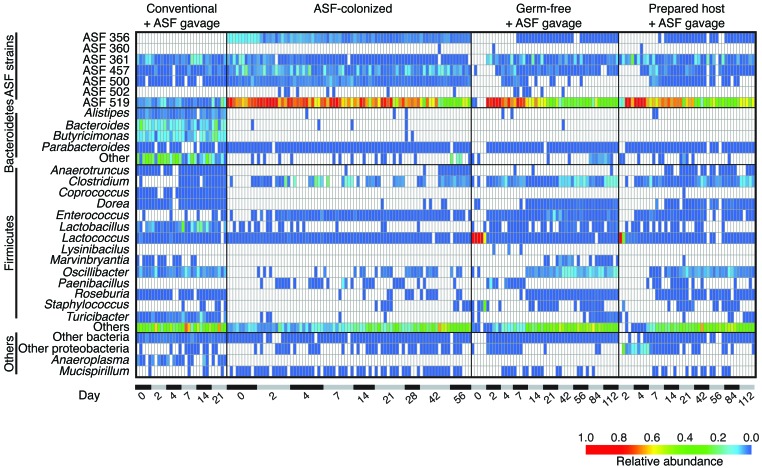
Figure 2. Heatmap showing the relative abundance of bacterial lineages over time in ASF-colonized mice and controls.
Rows indicate bacterial lineages as annotated on the left. Relative abundance is indicated by the color key at the bottom of the figure. Columns summarize the sequencing results from individual fecal specimens. Elapsed time in days is shown along the bottom. The groups studied are indicated at the top of the heatmap and include (from the left) conventional mice that were gavaged with ASF stool without preparation (Conventional + ASF gavage); mice that were ASF colonized from birth, then transferred to a nonsterile SPF facility (ASF-colonized); mice that were germ-free, then gavaged with ASF (Germ-free + ASF gavage); and conventional mice that were prepared with ABX and PEG treatment, then gavaged with ASF (Prepared host + ASF gavage).

