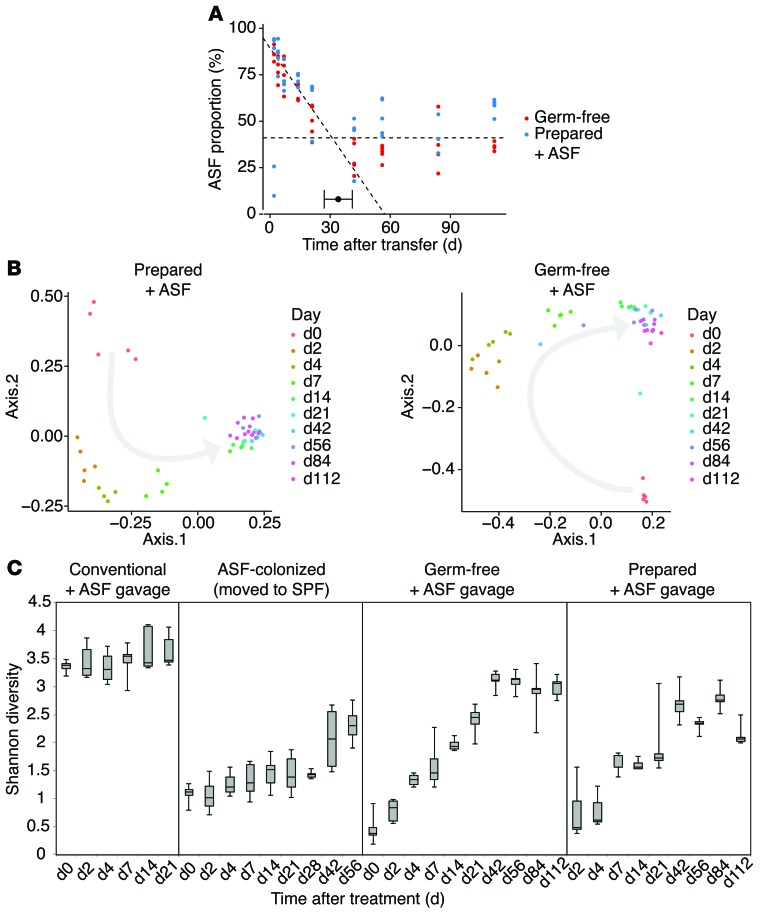
Figure 3. Development of a stable gut microbial community nucleated by inoculation with ASF.
(A) Segmented regression analysis of communities in mice that were either germ-free or prepared conventional mice subjected to ASF gavage. The y axis shows the proportion of ASF lineages inferred from 16S rRNA gene tag pyrosequencing data. The x axis shows the number of days after transfer. Segmented regression analysis showed 2 phases, indicating a slow decline in the ASF proportion up to about day 30, followed by establishment of a new steady state consisting of approximately 40% ASF lineages. (B) Principal coordinates analysis (PCoA) ordination over time. Changes in community membership over time were analyzed using unweighted Unifrac (61). Progression of time is indicated by a gray arrow. (C) Shannon diversity of gut microbiota over time in the 4 hosts described in Figure 2. n = 5 per group for Conventional + ASF gavage, Germ-free + ASF gavage, and Prepared + ASF gavage. n = 10 for ASF-colonized.

