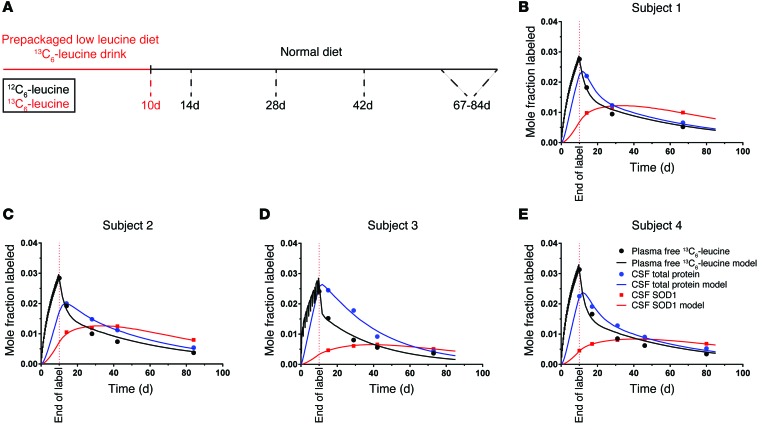
Figure 4. Modeling SOD1 kinetics in human CSF.
(A) Schematic of the oral labeling paradigm. Participants were placed on a prepackaged low-leucine diet and administered 13C6-leucine for 10 days, after which they resumed a normal diet. CSF and plasma were collected at the indicated time points, and total protein and SOD1 were isolated, digested, and analyzed by GC-MS and LC/tandem MS, respectively. (B–E) Data points with overlaid best-fit model curves (solid lines) of plasma-free 13C6-leucine, CSF total protein, and CSF SOD1 for human (B) subject 1, (C) subject 2, (D) subject 3, and (E) subject 4.

