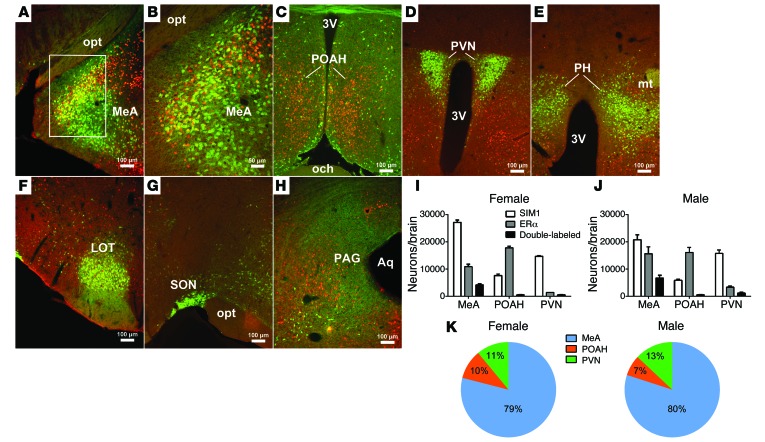
Figure 1. Colocalization of ERα and SIM1 in mouse brains.
(A–H) Dual immunofluorescence for GFP (green) and ERα (red) in the MeA (A and B), POAH (C), PVN (D), PH (E), LOT (F), SON (G), and PAG (H) in Sim1-Cre Rosa26-GFP mouse brains. B is higher magnification of the white box in A. 3V, 3rd ventricle; Aq, aqueduct; mt, mammillothalamic tract; och, optic chiasm; opt, optic tract. (I and J) Numbers of neurons expressing SIM1 (GFP), ERα, and both in the MeA, POAH, and PVN in female (I) and male (J) mice. Data are presented as mean ± SEM. n = 3/group. (K) Percentage distribution of ERα/SIM1 double-labeled neurons in the MeA, POAH, and PVN. Data are presented as mean ± SEM. n = 3/group.

