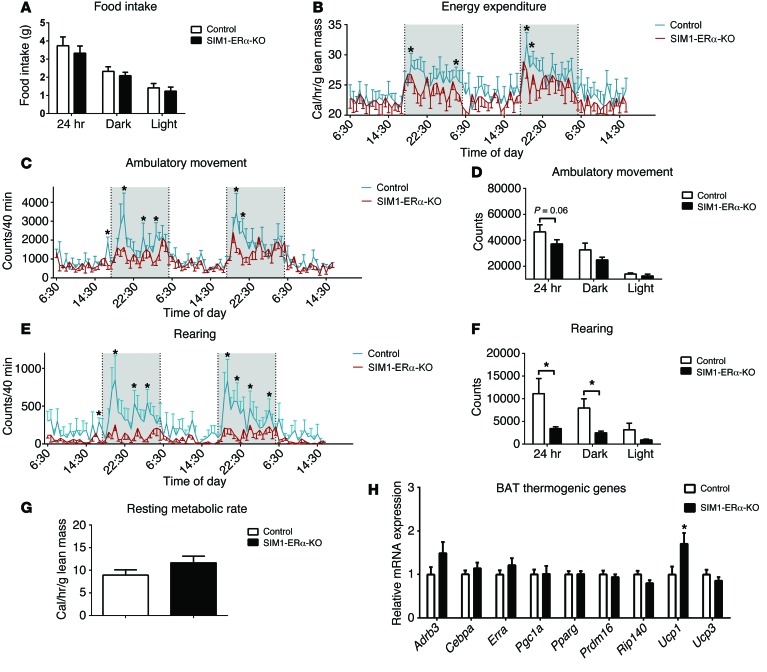
Figure 3. Metabolic profile of chow-fed female SIM1-ERα-KO mice.
(A) Food intake during 24 hour, dark , or light cycles. (B) Energy expenditure. (C and D) Ambulatory movement. (E and F) Rearing activity. (G) Resting metabolic rate. Note that mice had comparable body weight (control: 26.4 ± 1.1 vs. SIM1-ERα-KO: 28.3 ± 2.1, P > 0.05) and lean mass (control: 18.5 ± 0.4 vs. SIM1-ERα-KO: 18.1 ± 0.7, P > 0.05) at the time of the CLAMS study. (H) mRNA levels of thermogenic genes in BAT at 26 weeks of age. Data are presented as mean ± SEM. n = 8/group. *P < 0.05 in t test.

