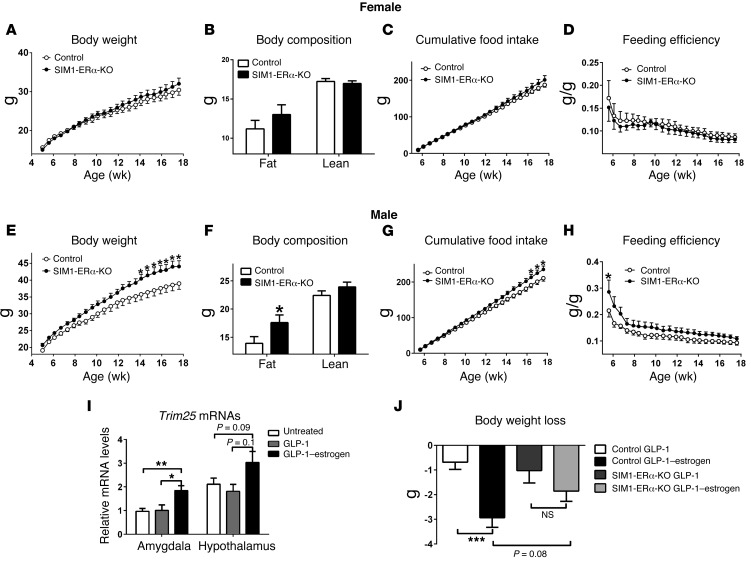
Figure 6. Metabolic profiles of HFD-fed SIM1-ERα-KO mice.
(A–D) Female control and SIM1-ERα-KO littermates were fed with HFD for 13 weeks since weaning (4 weeks of age). Body weight (A), body fat mass and lean mass (13 weeks after HFD feeding) (B), and cumulative food intake (C) were recorded. Feeding efficiency (D) was calculated as the ratio between changes in body weight and cumulative food intake. Data are presented as mean ± SEM. n = 18 or 21/group. (E–H) Male control and SIM1-ERα-KO littermates were fed with HFD for 13 weeks since weaning (4 weeks of age). Body weight (E), body fat mass and lean mass (13 weeks after HFD feeding) (F), and cumulative food intake (G) were recorded. Feeding efficiency (H) was calculated as the ratio between changes in body weight and cumulative food intake. Data are presented as mean ± SEM. n = 16/group. *P < 0.05 in 2-way ANOVA analysis followed by post hoc Bonferroni tests. (I) Relative Trim25 mRNA levels in the amygdala and hypothalamus of male C57Bl6 mice that were untreated, or received s.c. injections of GLP-1 (40 μg/kg) or GLP-1–estrogen (40 μg/kg) for 2 hours. Data are presented as mean ± SEM. n = 4–7/group. *P < 0.05 and **P < 0.01 in 1-way ANOVA analysis followed by post hoc Bonferroni tests. (J) Body weight loss in HFD-fed male control and SIM1-ERα-KO littermates that received s.c. injections of GLP-1 (40 μg/kg/d) or GLP-1–estrogen (40 μg/kg/d) for 4 days. Data are presented as mean ± SEM. n = 7–9/group. ***P < 0.001 in 2-way ANOVA analysis followed by post hoc Bonferroni tests.

