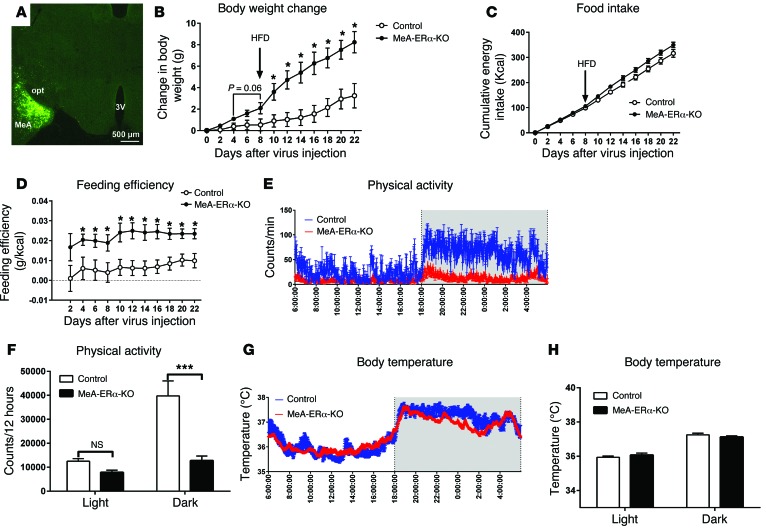
Figure 7. Metabolic profiles of MeA-ERα-KO mice.
(A) Post hoc visualization of GFP in the MeA in an Esr1fl/fl mouse receiving AAV-Cre-GFP stereotaxic injections. 3V, 3rd ventricle; opt, optic tract. (B) Gains in body weight after virus injections. Note that mice were fed with regular chow for the first 7 days and then with HFD for the rest period. Data are presented as mean ± SEM. n = 8/group. *P < 0.05 in 2-way ANOVA analysis followed by post hoc Bonferroni tests. (C) Cumulative food intake. (D) Feeding efficiency calculated as the ratio between changes in body weight (B) and cumulative food intake (C). Data are presented as mean ± SEM. n = 8/group. *P < 0.05 in 2-way ANOVA analysis followed by post hoc Bonferroni tests. (E) 24-hour physical activity measured in chow-fed mice. (F) Sum physical activity during the light or dark cycles. Data are presented as mean ± SEM. n = 8/group. ***P < 0.001 in 2-way ANOVA analysis followed by post hoc Bonferroni tests. (G) 24-hour body temperature measured in chow-fed mice. (H) Averaged body temperature during the light or dark cycles. Data are presented as mean ± SEM. n = 8/group.

