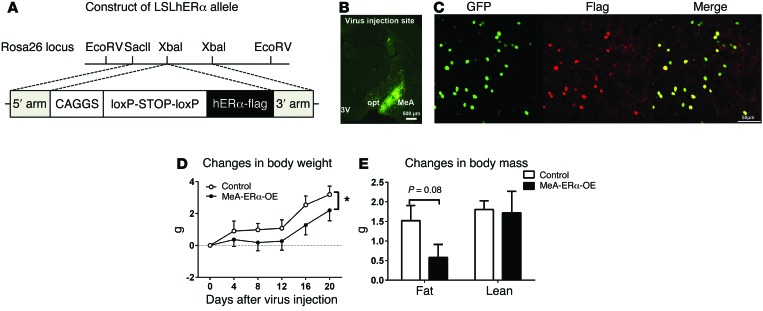
Figure 8. Metabolic profiles of MeA-ERα-OE mice.
(A) Schematic illustration of the LSLhERα mouse allele. (B) Post hoc visualization of GFP in the MeA in an LSLhERα mouse receiving AAV-Cre-GFP stereotaxic injections. 3V, 3rd ventricle; opt, optic tract. Scale bar: 500 µm. (C) Colocalization of GFP and flag immunoreactivity in the MeA in an LSLhERα mouse receiving AAV-Cre-GFP stereotaxic injections. Scale bar: 500 µm. (D and E) Gains in body weight (D), and fat/lean mass (E) in HFD-fed MeA-ERα-OE mice and control mice. Data are presented as mean ± SEM. n = 8/group. *P < 0.05 in 2-way ANOVA analysis followed by post hoc Bonferroni tests.

