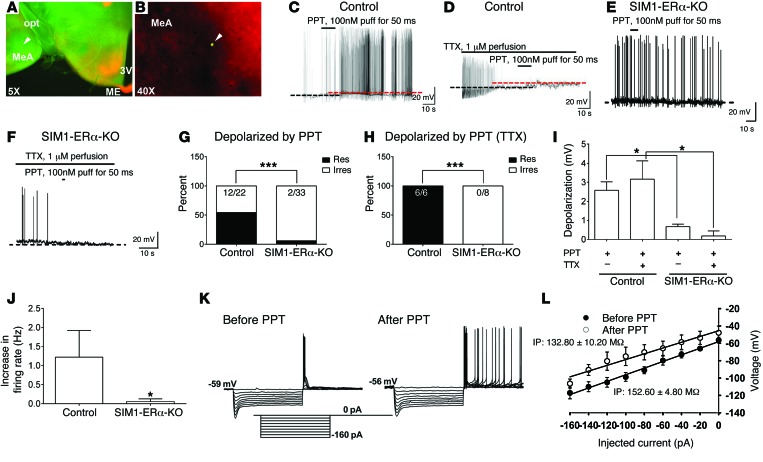
Figure 9. Effects of a selective ERα agonist on neural activities of MeA SIM1 neurons.
(A and B) A recorded MeA SIM1 neuron, filled with the green Allex488 dye, in the brain slice from a Sim1-Cre Rosa26-tdTOMATO mouse was indicated by the arrowhead. 3V, 3rd ventricle; ME, median eminence; opt, optical tract. (C–F) Representative responses to PPT (100 nM, 50 ms puff) in the absence (C and E) or the presence of 1 μM TTX (D and F) on MeA SIM1 neurons from control mice (C and D) or from SIM1-ERα-KO mice (E and F). (G and H) The percentage of neurons that were depolarized by PPT puff in the absence (G) or the presence (H) of 1 μM TTX. ***P < 0.001 in χ2 test. (I) PPT-induced depolarization. Data are presented as mean ± SEM. n = 6–33. *P < 0.05 in 2-way ANOVA analysis followed by post hoc Bonferroni tests. (J) PPT-induced increases in firing rate. Data are presented as mean ± SEM. n = 8–9. *P < 0.05 in Wilcoxon signed rank test. (K) Representative membrane voltage responses to series depolarizing steps (from –160 pA to 0 pA in steps of 20 pA) for 1 second before and after PPT treatment. (L) Current-voltage curves before and after PPT treatment. Input resistance (IP) was determined by the slope of a linear regression fitted line of current-voltage curve. Results are shown as mean ± SEM.

