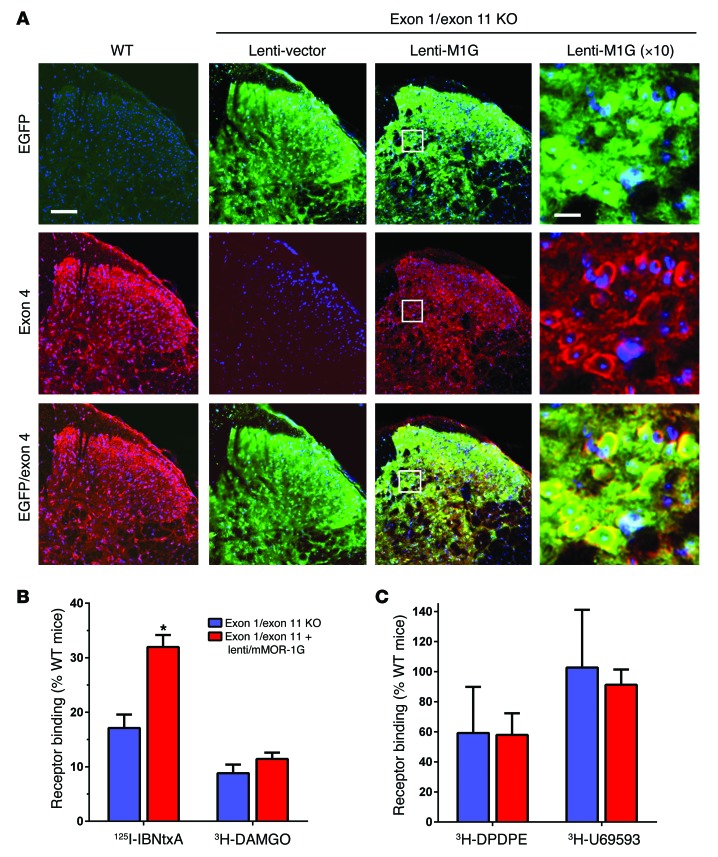
Figure 2. Lentivirus expression in the spinal cord following intrathecal administration.
(A) Distribution of lentiviral-expressed mMOR-1G (lenti–mMOR-1G) and EGFP. An exon 4 antibody was used for staining mMOR-1G. Nuclei were stained with DAPI. Scale bars: 100 μm in first three columns and 10 μm in last column. (B and C) Receptor binding in the spinal cord of exon 1/exon 11 KO mice without and following lenti–mMOR-1G (percent of WT; mean ± SEM from 3–4 pooled samples. Each pool contains the spinal cord from 2–3 mice). Significant differences between WT, exon 1/exon 11 KO, and lenti–mMOR-1G groups were seen with ANOVA for 125I-IBNtxA and 3H-DAMGO (*P < 0.001) (A) but not 3H-DPDPE and 3H-U69,593 (B). For 125I-IBNtxA, the exon 1/exon 11 KO and the lenti–mMOR-1G groups differed from WT (P < 0.001) and from each other (P < 0.05; Tukey). For 3H-DAMGO, the exon 1/exon 11 KO and the lenti–mMOR-1G groups differed from WT (P < 0.001) but not from each other (P > 0.05).

